


Europe Open, DAX 30, EUR/USD, US-China Trade War – Talking Points:
- Risk-associated currencies gained whilst global equities slid during Asia-Pacific trade
- DAX 30 perched at pivotal support, at risk of further declines.
- EUR/USD remains confined within a potential Bull Flag formation. Break out or break down?
Asia-Pacific Recap
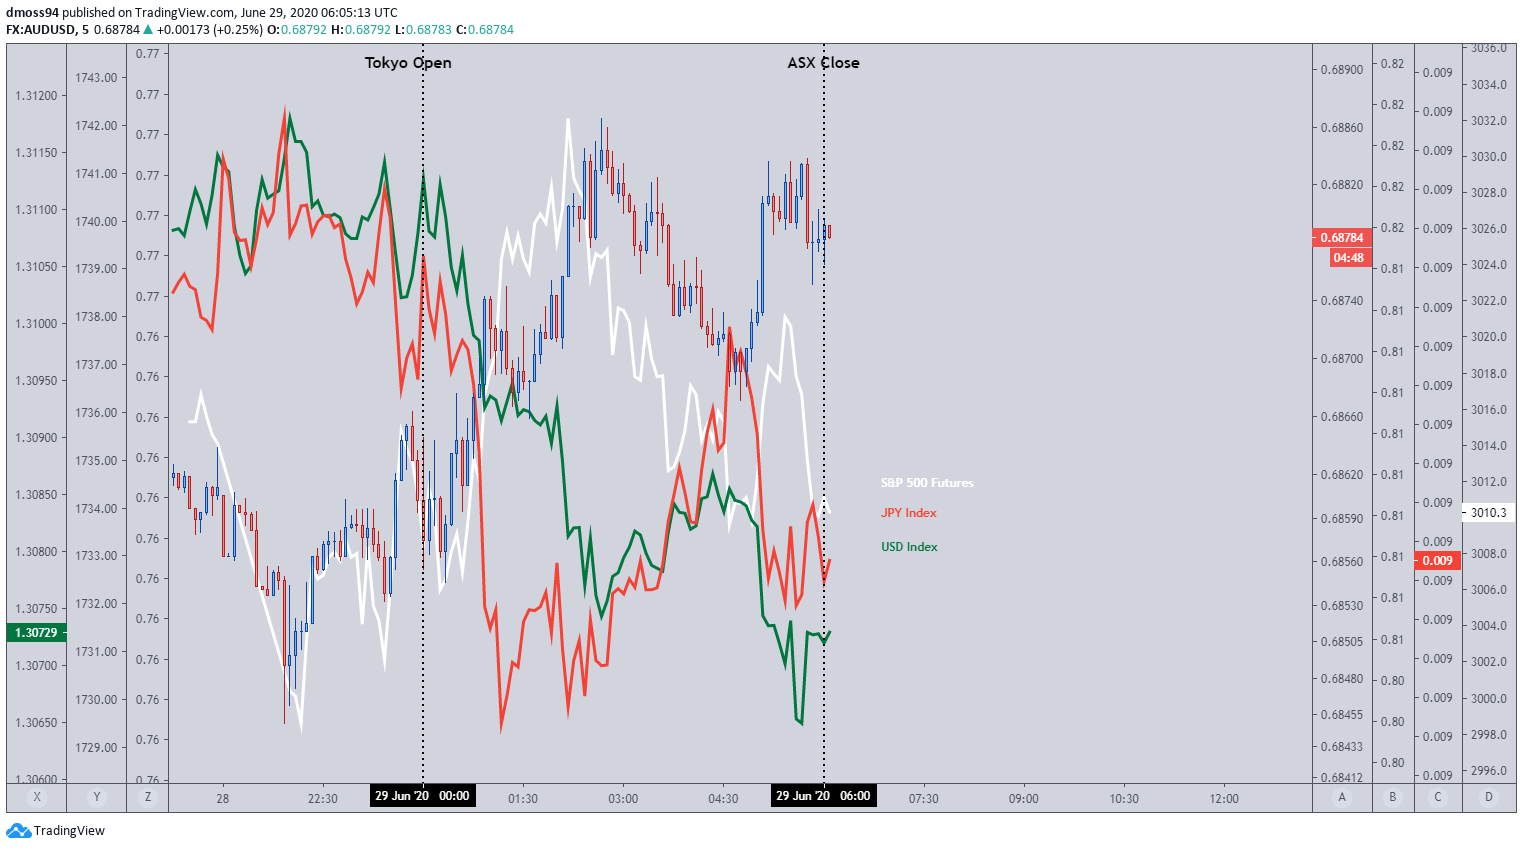
Month end flows could be the culprit behind ‘whacky’ price action throughout the Asia-Pacific session as risk-sensitive currencies displayed broad gains against the haven-associated Japanese Yen and US Dollar, whilst global equities declined following Wall Street’s sell-off on Friday.
The sobering reality that the novel coronavirus has caused 500,000 deaths globally may continue to drag on risk appetite into the upcoming sessions as several US states consider halting the staggered approach of reopening their local economies.
Looking ahead, investor focus will remain fixated on Federal Reserve Chair Jerome Powell and Treasury Secretary Steven Mnuchin testimony before the House Financial Services Committee on Tuesday, with any talk of further stimulus measures possibly fueling a recovery in risk-appetite.
Business and consumer confidence data from the Eurozone may also prove of interest as sentiment looks to rebound from the lowest readings since September 2009.
Source - TradingView
US-China Tensions Intensify, Weighing on Risk Appetite
At the same time, the ongoing spat between the world’s two biggest economies continues to hamper the recovery of global assets prices, which may intensify ahead of the US election in November.
The most recent exchange between the two juggernauts has seen the Pentagon release a list of 20 “Communist Chinese military companies operating in the United States” on June 24, inclusive of the controversial Huawei technologies.
As expected, the response from Beijing was one of fierce opposition to the increased scrutiny brought upon Chinese entities, with retaliation possibly bringing US tech giants Tesla, Apple and Qualcomm into the crosshairs.
With both democrats and republicans intent on building a campaign focused on US-Sino relationships, the possibility of escalating tensions is more than likely, which may continue to sap the appeal of risk-associated assets.
DAX 30 Perched Precariously at Pivotal 12,000-Level
Source - TradingView
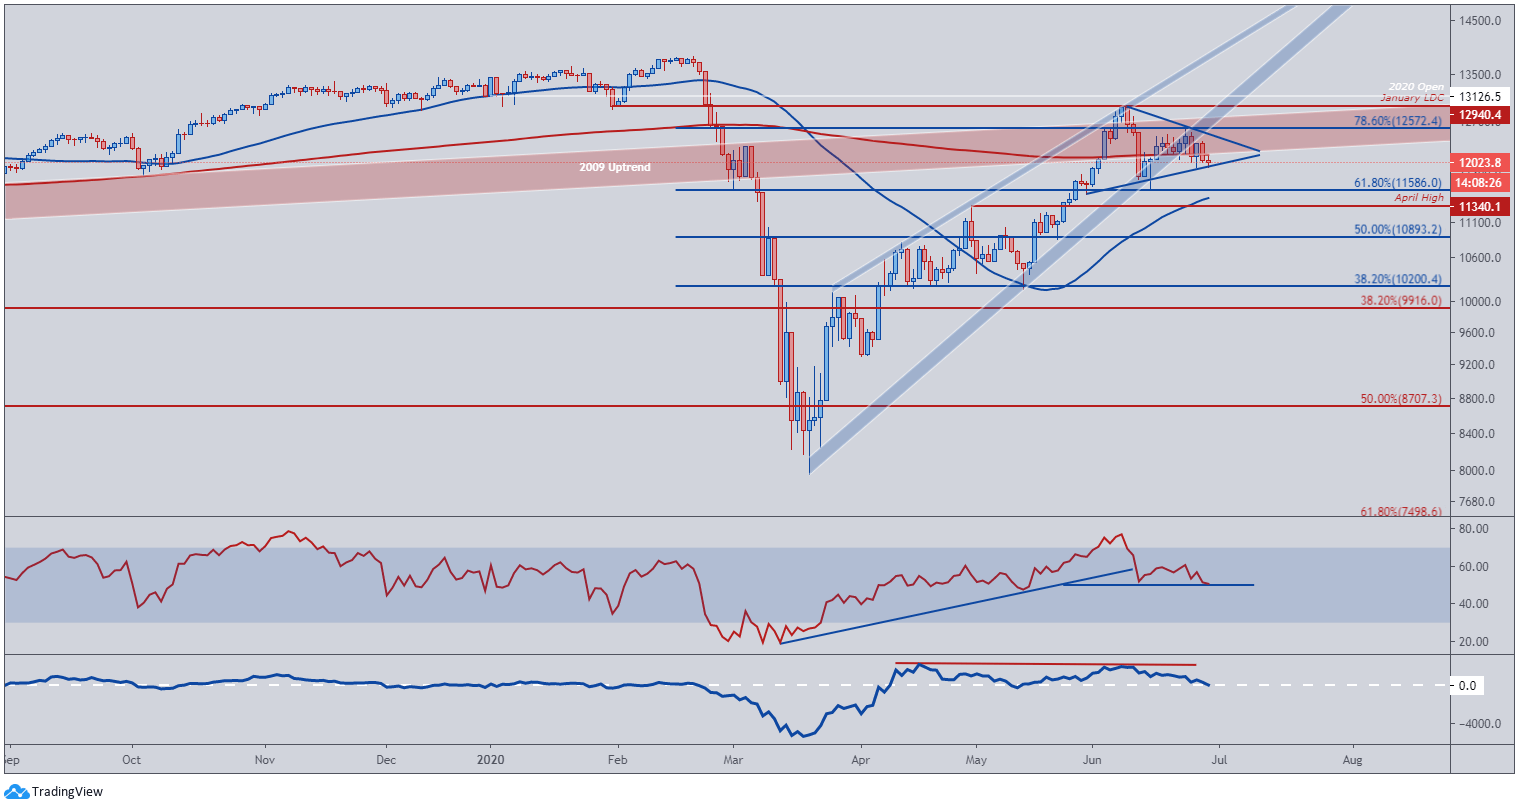
The psychologically imposing 12,000-handle is providing a temporary level of support for the German benchmark index as price consolidates within a Symmetrical Triangle pattern.
With resistance at the 78.6% Fibonacci (12,572) proving impenetrable in the last two weeks of trade, the path of least resistance remains to the downside, with support at the 61.8% Fibonacci (11,586) acting as the last line of defence.
The momentum indicator tentatively reinforces the bearishness seen in recent price action as it nudges into negative territory for the first time since mid-May, whilst the RSI hovers above the neutral reading of 50.
A break through triangle support could trigger a surge of selling pressure, with a key region of interest falling at the 50-day moving average (11,461) and April high (11,340).
| Change in | Longs | Shorts | OI |
| Daily | -9% | 7% | 2% |
| Weekly | -27% | 9% | -5% |
EUR/USD Bull Flag or Breakdown?

Source - TradingView
EUR/USD continues to hold above the 61.8% Fibonacci (1.1167) after retreating from the monthly high (1.1422) as price consolidates in a possible Bull Flag formation.
The outlook for EUR/USD remains constructive above the 23.6% Fibonacci (1.1202), with a break above resistance at the 78.6% Fibonacci (1.1312) possibly igniting buying pressure.
The RSI remaining constructive and the 50-day moving average (1.1112) crossing above the 200-MA reinforces the argument for continued appreciation for the EUR/USD exchange rate.
Having said that, divergence between the RSI and momentum suggests there may be a potential for an impending breakdown.
A close below support at the 61.8% Fibonacci (1.1167) could invalidate the potential Bull Flag formation, carving a path back to the 200-MA and 1.10-handle.
However, a daily close above resistance at the 78.6% Fibonacci (1.1311) could lead to a retest of the monthly high (1.1412), with the yearly high (1.1495) a possible target should an intense breakout occur.
| Change in | Longs | Shorts | OI |
| Daily | -1% | -4% | -3% |
| Weekly | 4% | -10% | -5% |
-- Written by Daniel Moss
Follow me on Twitter @DanielGMoss


