S&P 500, Nasdaq 100, Dow Jones Talking Points:
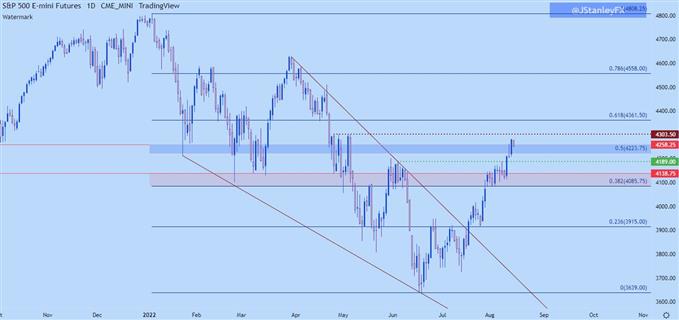
- The equity rally has continued and tomorrow marks the two-month-mark since the S&P 500 set a fresh two-year-low. The index is approaching a big spot of resistance around the 4304 level.
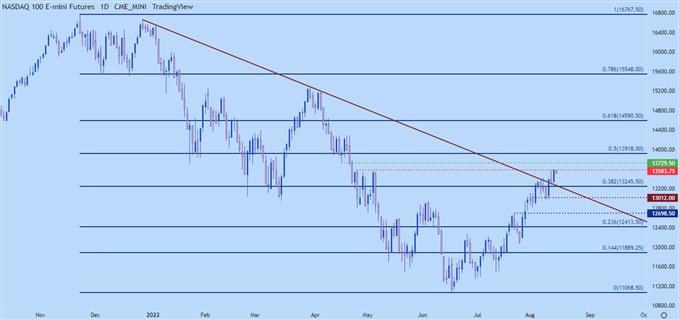
- The Nasdaq 100 has already set a fresh three-month-high, finding resistance at a familiar level that was last in-play in late-April/early-May.
- The analysis contained in article relies on price action and chart formations. To learn more about price action or chart patterns, check out our DailyFX Education section.


The equity rally is going on two months now. The Nasdaq 100 set its current two-year-low on June 16th and the S&P 500 was a day later on the 17th. The June FOMC rate decision was on the 15th, so logically we can look back and pair the two of those events together to associate some type of relationship.
The big question is whether that low is something that will hold for much longer or whether the bounce since is but a reprieve in a bigger-picture bearish theme. And there’s fervent argument on both sides of the equation.
From the bullish perspective – the Fed did a lot of rate hikes very quickly, and they may be nearing a point where they want to pause in order to allow those hikes to transmit through the economy while waiting on data to see how effective they’ve been. For this argument, bulls can point to a number of comments from Chair Powell at the last FOMC rate decision, such as when he said that the Fed is already at the ‘neutral rate.’
On the other side of the coin in the bearish camp, the focus is on more rate hikes and higher rates. This camp either expects inflation to continue increasing or they expect that it’ll hang around much longer unless the Fed forces more and more hikes. And that continued ramping up of pressure is something that further exposes vulnerability in an economy that’s been supported by stimulus for the better part of the past 13 years.
S&P 500
The S&P 500 has now pared its loss in the 2022 trend to -10.97% using Friday’s high, which is impressive considering that the index was down by about -25% at the mid-June low. The index had formed a falling wedge formation which is often tracked for bullish reversals.
And reverse it did, gaining as much as +17.92% in less than two months, even as the Fed put in another 75 bp hike in late-July. Price has broken above a number of resistance levels on the way and there were a number of possible bear traps, such as last Thursday when price closed as a shooting star formation after failing to hold above the 50% mark of the 2022 sell-off.
At this point, there’s a big resistance level sitting just overhead, around the 4304 level. This was a price that was last in-play in late April and early-May, setting a double top that turned into a triple top, eventually leading to a downside breakdown on the way to those fresh two-year-lows. A break-above that opens the door for a move up towards the 61.8% Fibonacci retracement of the sell-off move, plotted around 4362.
On the support side of the matter, near-term support can be tracked around that 50% mark that came into play last week, spanning up to price action resistance at 4258. Below that, another swing of note is in the picture around 4189, after which key support comes into play from 4085-4138.


S&P 500 Daily Price Chart

Chart prepared by James Stanley; S&P 500 on Tradingview
Nasdaq 100
The Nasdaq had a big week last week, crossing above a bearish trendline while extending the bounce from June lows to over 22%. And further illustrating that strength, while the S&P 500 is a little ways from re-testing the triple-top that set in late-April/early-May, the Nasdaq 100 is already at that similar level, which plots around 13,583 using the top of the wick from the April 26th high.
This was the price that came into play late last week to help set the current three-month-high. But, also contrasting with the S&P 500 above, while the blue-chip index finds support above the 50% mark of the recent sell-off, the Nasdaq 100 is still a ways away, with that similar level plotted at 13,918.
In the event of continued breakout, that Fibonacci level becomes resistance potential, and between current resistance and that level is a price action swing that plots at 13,729.
On the support side of the Nasdaq, the 38.2% retracement of the sell-off is currently confluent with the bearish trendline that was tested through last week, and that’s at 13,245. The psychological level at 13k is confluent with prior price action support, which comes from resistance-turned-support. And below that is another point of prior price action resistance, which comes in around 12,699.


Nasdaq 100 Daily Chart

Chart prepared by James Stanley; Nasdaq 100 on Tradingview
--- Written by James Stanley, Senior Strategist, DailyFX.com & Head of DailyFX Education
Contact and follow James on Twitter: @JStanleyFX


