


Australian Dollar Talking Points:
- The Aussie sprung back to life earlier in the week.
- AUD/USD is holding above a key area of support, while AUD/JPY remains very near highs while trying to hold support along a short-term bullish trendline.
- The analysis contained in article relies on price action and chart formations. To learn more about price action or chart patterns, check out our DailyFX Education section.

From famine to feast in a week. Well, feast might be overstated but the response in AUD/USD after setting a fresh two-year-low last Thursday is encouraging for bulls.
Just last Thursday, AUD/USD has plunged down for a fresh two-year-low. Prices pushed below a key retracement from a Fibonacci setup that spans from the 2020 low to the 2021 high, but buyers pulled the bid back-above that level by the end of the week. That elongated wick on the underside of last week’s candle has led to a continued bullish run so far this week, and prices have broken out of a falling wedge formation, which keeps the door open for bullish continuation strategies.
AUD/USD Weekly Price Chart
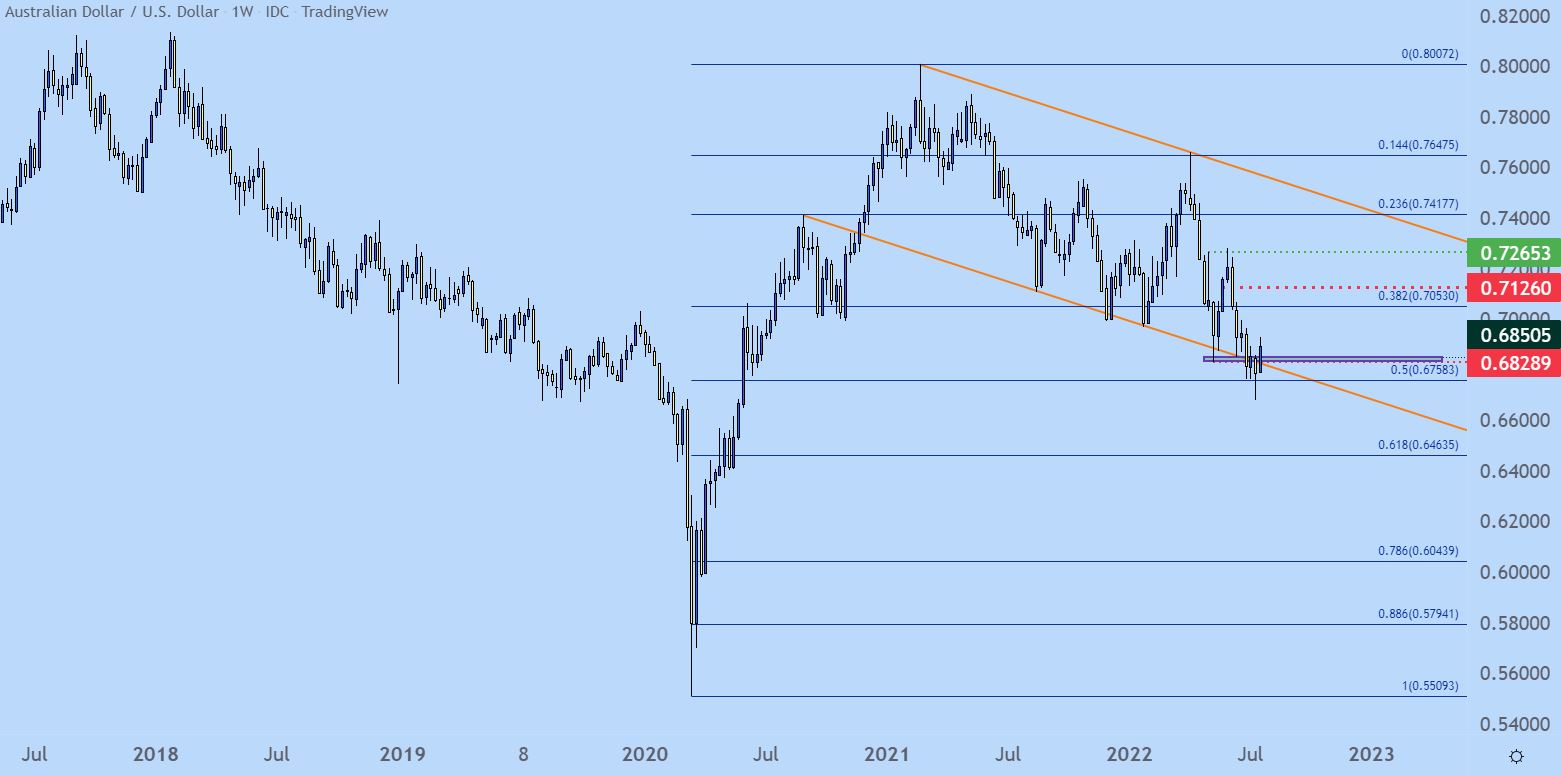
Chart prepared by James Stanley; AUDUSD on Tradingview
Shorter-term, the big question is whether buyers can hold price above the .6850 spot of support. This was a swing-low in May and early-June before becoming resistance in July.
Given the recent breakout from the falling wedge formation shown on the four-hour chart below, a hold of higher-low support keeps the door open for topside continuation scenarios, with next resistance around the .7000 psychological level.
AUD/USD Four-Hour Price Chart
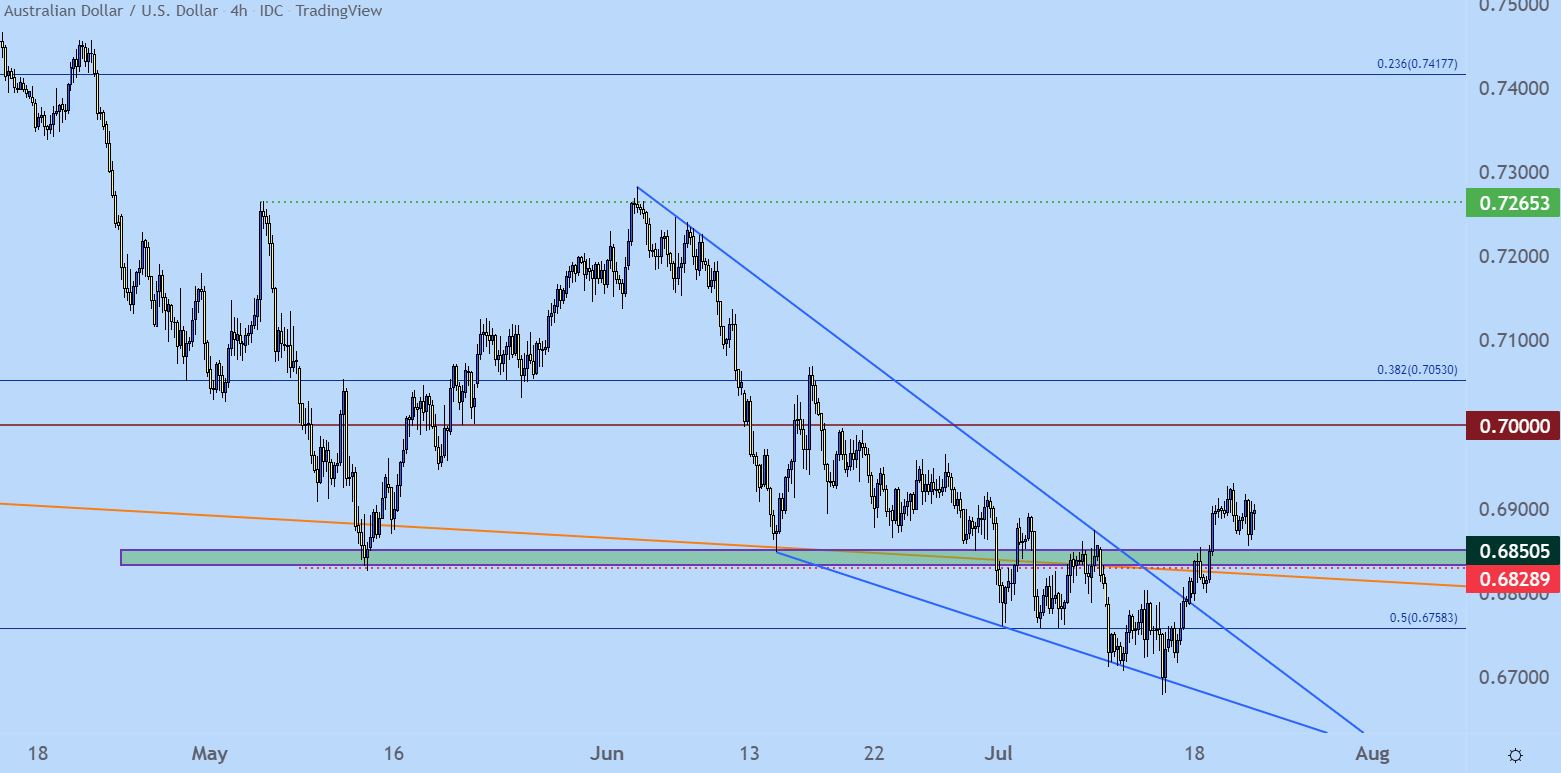
Chart prepared by James Stanley; AUDUSD on Tradingview
AUD/JPY
While AUD/USD was setting that fresh two-year-low last week, AUD/JPY has remained in a bullish trajectory, helped along by Yen-weakness that’s remained as a dominant theme across FX.
Longer-term, the current zone of resistance is a notable one as it’s held the highs in April and again in June, with a bit of breach on that second test. There’s also the higher-low that printed after that second test, which opens the door for an ascending triangle formation which points to bullish breakout potential.
AUD/JPY Weekly Chart
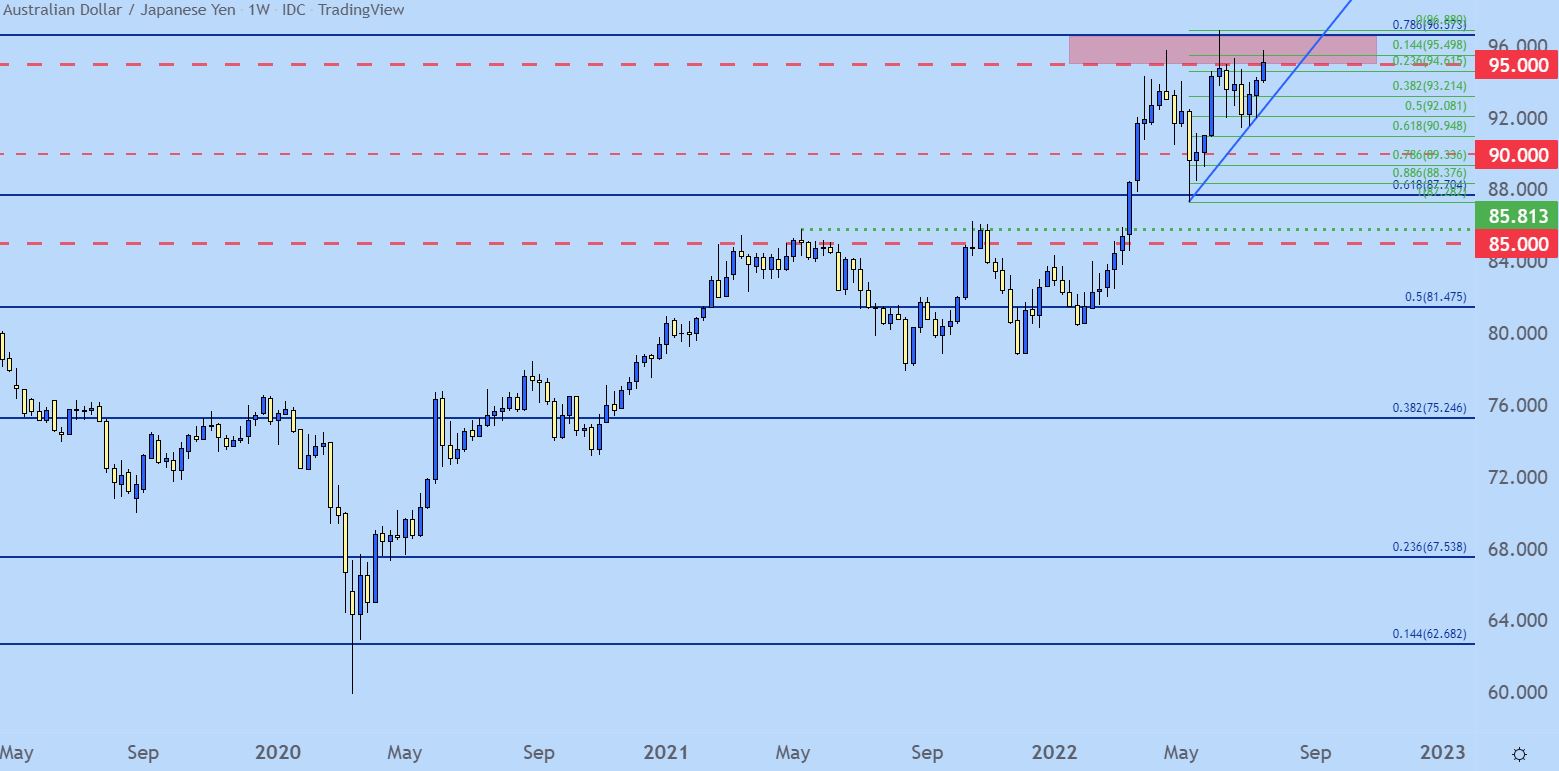
Chart prepared by James Stanley; AUD/JPY on Tradingview
On a shorter-term basis, we can even see a support test taking place at a key spot on the chart of AUD/JPY. There’s a bullish trendline connecting lows going back to July 11th that’s now confluent with the psychological level at the 95.00 handle. A hold here keeps the door open for that breakout potential, with eyes on the top-end of the zone at 96.57.
AUD/JPY Four-Hour Chart
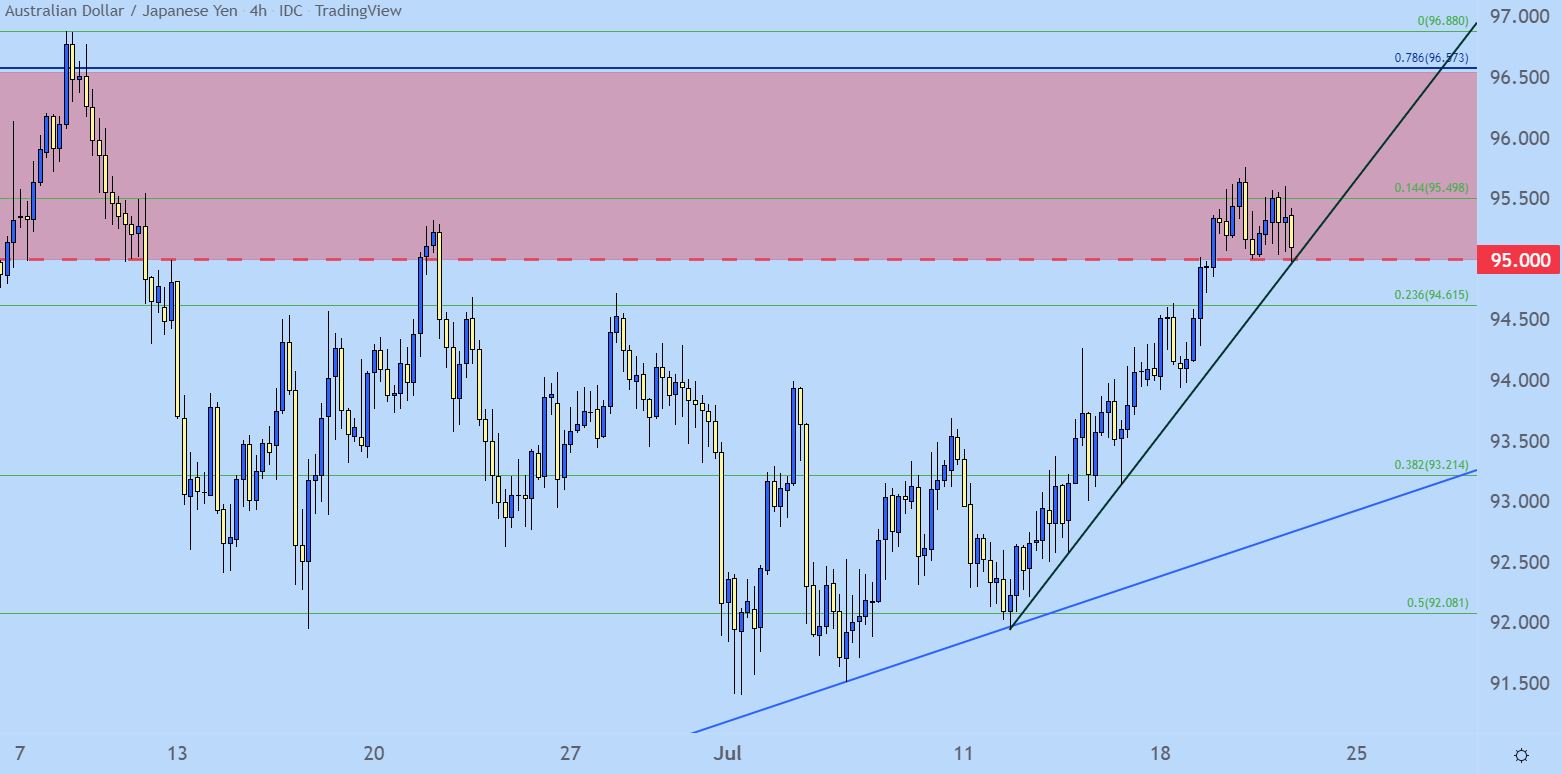
Chart prepared by James Stanley; AUD/JPY on Tradingview
--- Written by James Stanley, Senior Strategist for DailyFX.com
Contact and follow James on Twitter: @JStanleyFX


