


Gold Talking Points:
- Gold prices have pushed down to key support at 10-month lows.
- USD strength, as driven by inflation has been a strong theme of late and that’s helping to drive the move in Gold – this week brings a CPI print out of the US on Wednesday and this could produce some additional drive in that move in Gold.
- The big question is what happens at $1673 which is the current two-year-low in Gold and a price that’s held support through a couple of different iterations. A break-below that represents a further ‘pricing out’ of the same theme that propelled the breakout in the summer of 2020.
- The analysis contained in article relies on price action and chart formations. To learn more about price action or chart patterns, check out our DailyFX Education section.

Gold prices are on their backfoot and for the past four weeks, buyers haven’t been able to produce much to stand in the way of the downtrend. Prices found resistance at a key Fibonacci level in early-June, producing a rising wedge formation along the way. Rising wedges will often be approached with the aim of bearish reversals and that’s continued to play out as sellers have pushed prices all the way down to fresh 10-month-lows.
Current support has a bit of relevancy to that prior resistance, as well, as it was the 50% marker of the 2020-2021 move that helped to set that marker early last month, and the 14.4% retracement from that same study is coming into play this morning to try to help hold the low.
I had written about this setup in early-June just after the rising wedge was confirmed and a few days before the breakdown began.
Gold Daily Price Chart
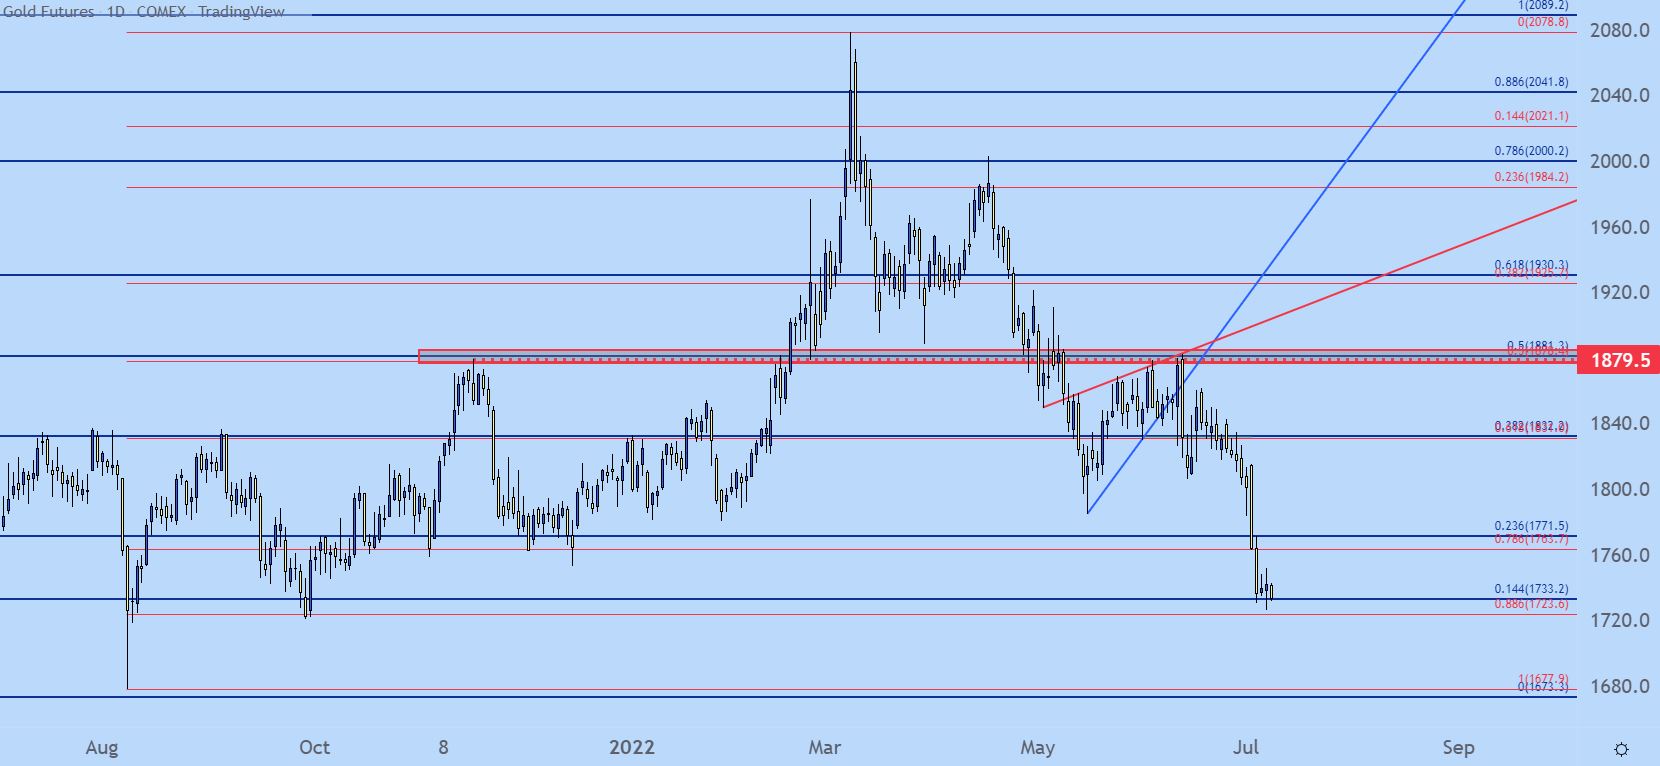
Chart prepared by James Stanley; Gold on Tradingview
Gold Volatility to Face Stiff Test as Calendar Heats Up
There’s a number of push-points for the bearish theme in Gold, including a continued surge in the US Dollar which has set yet another fresh 20-year-high to kick off this week. But – behind the USD move is something that’s also pertinent to Gold, both directly and indirectly, with inflation. CPI is set to be released on Wednesday and markets are expecting another fresh 40-year-high to print.
When this happened last month, Gold prices actually put in a bounce – right up to the Fibonacci level at 1881. This was on a Friday and when the market opened the following week that move was faded out and then some as sellers took advantage of that move.
But, for some context – there was a confluent area of support that had come into play just before that print around the 1830 handle (showed with orange box on the below chart), which led to that quick bounce up to 1881 before sellers were able to grab control and induce a bearish trend that remains in-play today, almost a month later.

Gold Four-Hour Price Chart
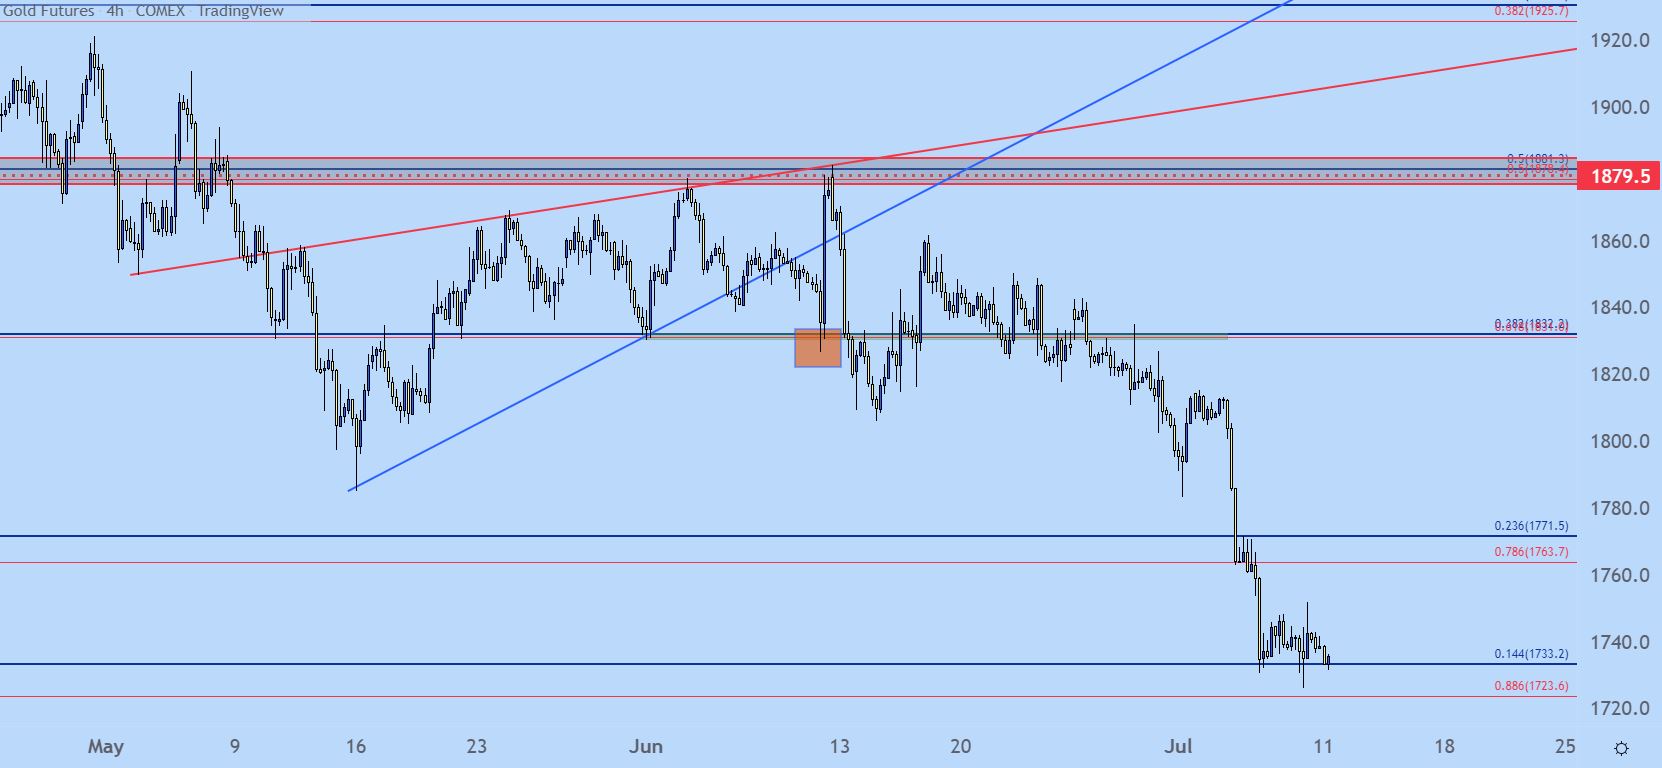
Chart prepared by James Stanley; Gold on Tradingview
Gold Strategy Moving Forward
The one clear item here is that the dominant trend in Gold is bearish. And at this specific point in time, prices are resting on support near a key low. So, while the sell-off remains enticing, current levels could produce a challenge for that approach.
And, also given how Gold responded to CPI last month, jumping by more than $50 on the heels of an inflation beat, there’s potential for volatility in the matter as we get the next data point for CPI on Wednesday of this week. That’s not to say that another $50 bounce will take place but, a bounce remains possible as we saw very recently, even in the event of higher inflation reads.
At this point Gold prices are sitting on a support zone that was last in-play in October of last year, helping to hold the low and this zone runs between 1723 and 1733, both Fibonacci levels of note. A bit higher, from 1763-1771, is another zone of interest that presents resistance potential. And if that doesn’t hold the highs, there’s a prior spot of short-term support around 1805 that could present another area of interest for lower-high resistance potential.
Gold Daily Chart
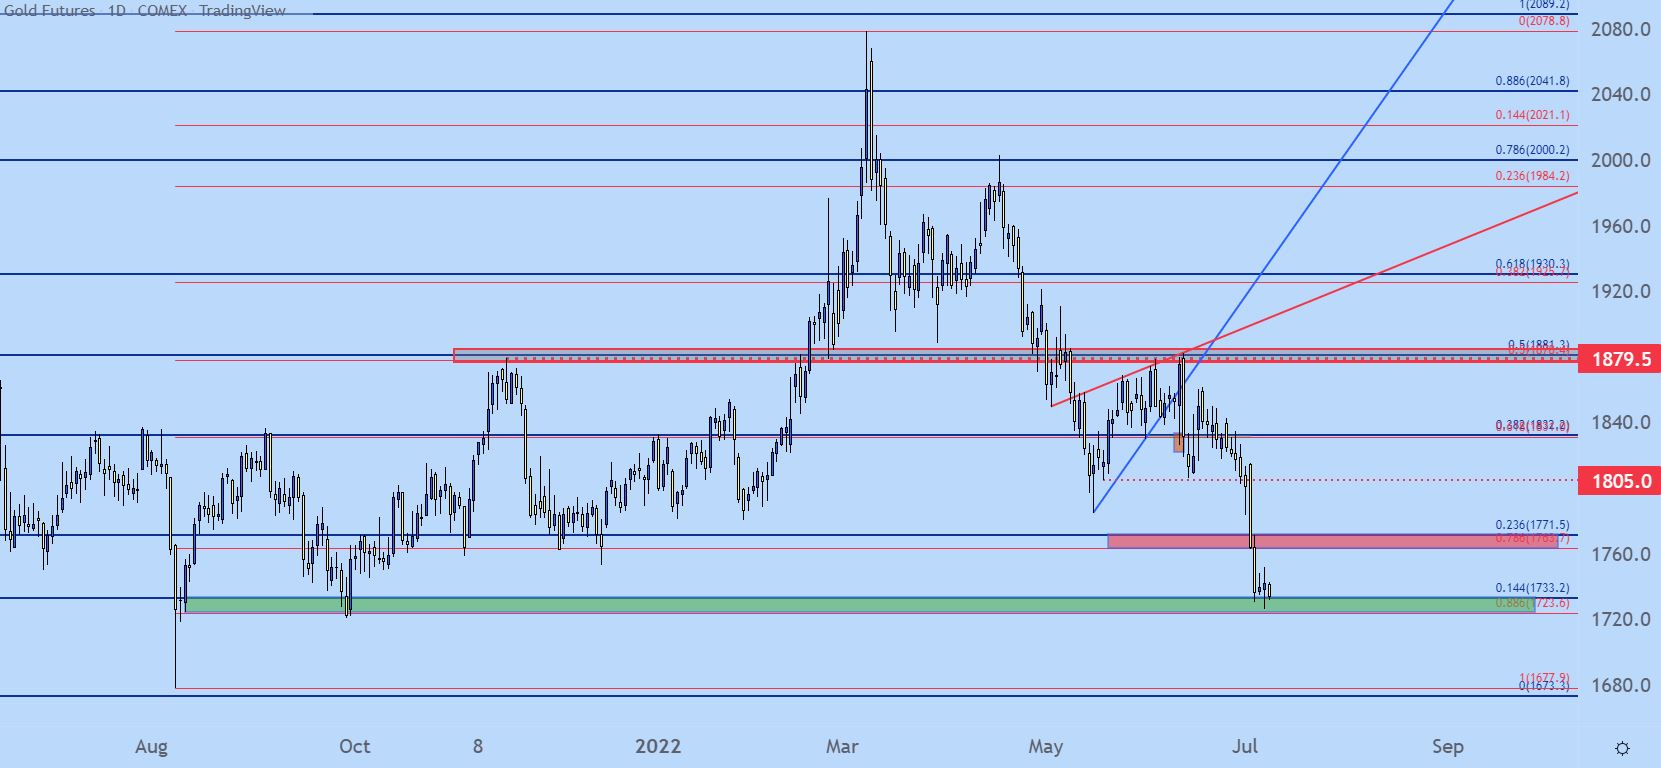
Chart prepared by James Stanley; Gold on Tradingview
Gold Bigger Picture
Gold prices have been in a range for almost two full years now. It was August 7th of 2020 when Gold prices hit their peak at $2,089, and since then buyers have been held at bay as a sizable range has developed.
The support side of that range has already faced a few tests, and nothing since August 9th of last year when prices quickly flickered below the $1,680/oz mark. A breach below that leads to fresh two-year-lows in Gold prices, and there’s not much significant support until around $1,450/oz.

Gold Weekly Price Chart
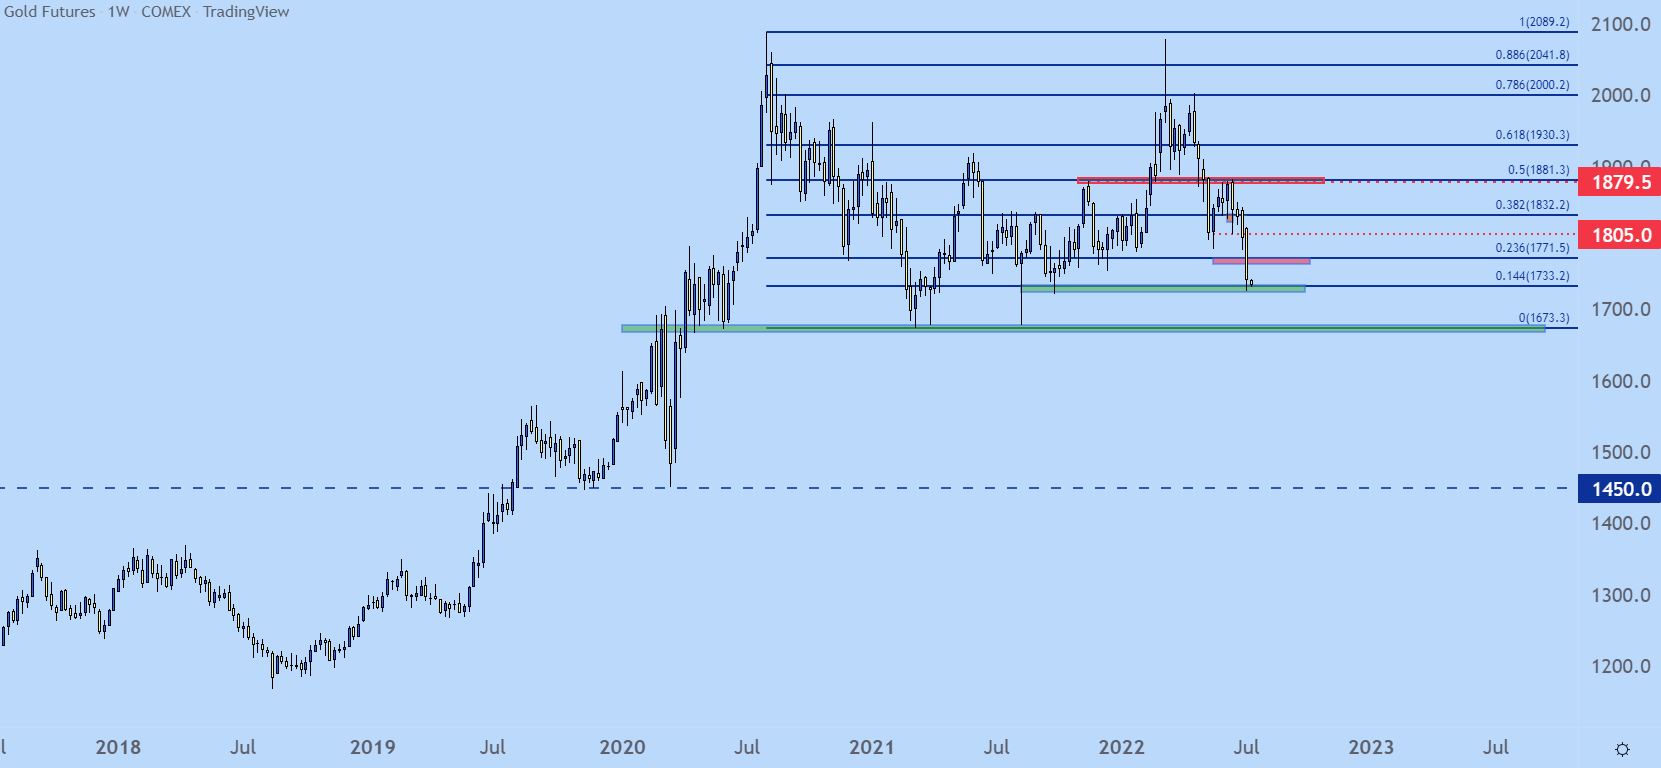
Chart prepared by James Stanley; Gold on Tradingview
--- Written by James Stanley, Senior Strategist for DailyFX.com
Contact and follow James on Twitter: @JStanleyFX


