


US Dollar Talking Points:
- We’re nearing quarter-end of a Q1 that saw an explosive move develop in the US Dollar. As we near the close tomorrow, prices in USD have moved right back to range support.
- The range in the USD has now held through much of March, even as the FOMC began lift-off with their first rate hike since 2018. Next quarter is expected to bring the first 50 basis point hike out of the FOMC, along with questions of how the Fed is going to manage the balance sheet. This can lead to continued USD volatility.
- The analysis contained in article relies on price action and chart formations. To learn more about price action or chart patterns, check out our DailyFX Education section.

We’re nearing the final day of what’s been a volatile and busy first quarter of the year. The big takeaway was that the Fed has started lifting rates in their effort of battling inflation. But, on the other side of the equation we also had the breakout of a war in Europe that still carries some pretty heavy potential consequences, especially on the topic of inflation as deglobalization threatens to bring more volatility to inflation forecasts in the coming months.
This may further hamstring the Fed in the event of an equity market sell-off. And as we’ve heard directly from Fed-speakers such as Neel Kashkari, the bank is trying to engineer a soft landing. But, as we heard yesterday from former NY Fed President William Dudley, this seems a low probability outcome given how stretched inflation has become. This is going to require the Fed to act and as we’ve seen in the past, the bank’s intentions have often been unsettled by market volatility.
But what makes this time different is inflation and the fact that the Fed can’t so easily back down from this hawkish stance that they’ve had to build in response to the environment.
This keeps the door open for upside in the USD, and Q1 was a big showing of that theme as the Greenback jumped higher during the period, holding within a bullish trend channel that originated a year ago. The March monthly bar is showing as green but much of that gain posted in the first couple of days, with the rest of the month showing a range in DXY.
But, from the weekly chart below the trend remains fairly clear, and given fundamentals, it would seems as though there’s scope for more as we move deeper into 2022 trade.
US Dollar Weekly Price Chart
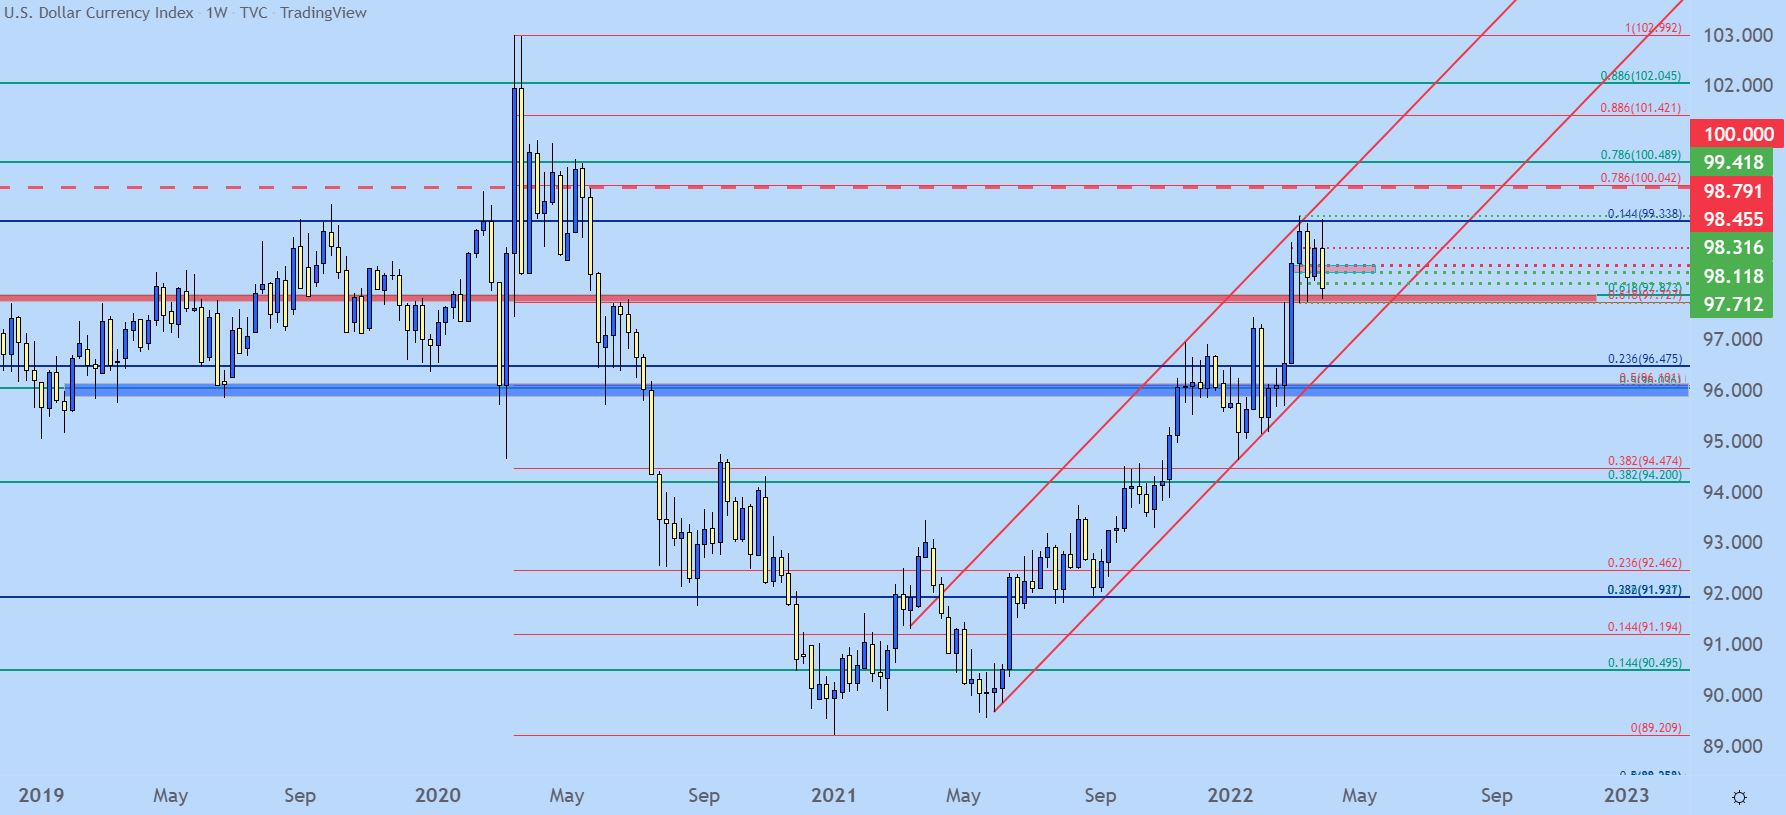
Chart prepared by James Stanley; USD, DXY on Tradingview
US Dollar Shorter-Term
The US Dollar range is quite evident on the four-hour chart, where there’ve been a few trips to both support and resistance as this backdrop has built. The support side of the formation is especially clear as this spans between two longer-term Fibonacci levels that started to come into play earlier in March, right after a CPI print.
The second inflection at this zone showed up after the FOMC rate hike. That second inflection led to a higher low which then brought in another bullish run up to resistance which, again technically posted a slightly higher-high from the prior swing. This may be alluding to eventual breakout potential but for now, the range remains and support is in-play.
Given the timing and taken with the trends, the next couple of days could be pretty volatile here as we go through quarter-end and open up Q2 with NFP on Friday.
US Dollar Four-Hour Price Chart
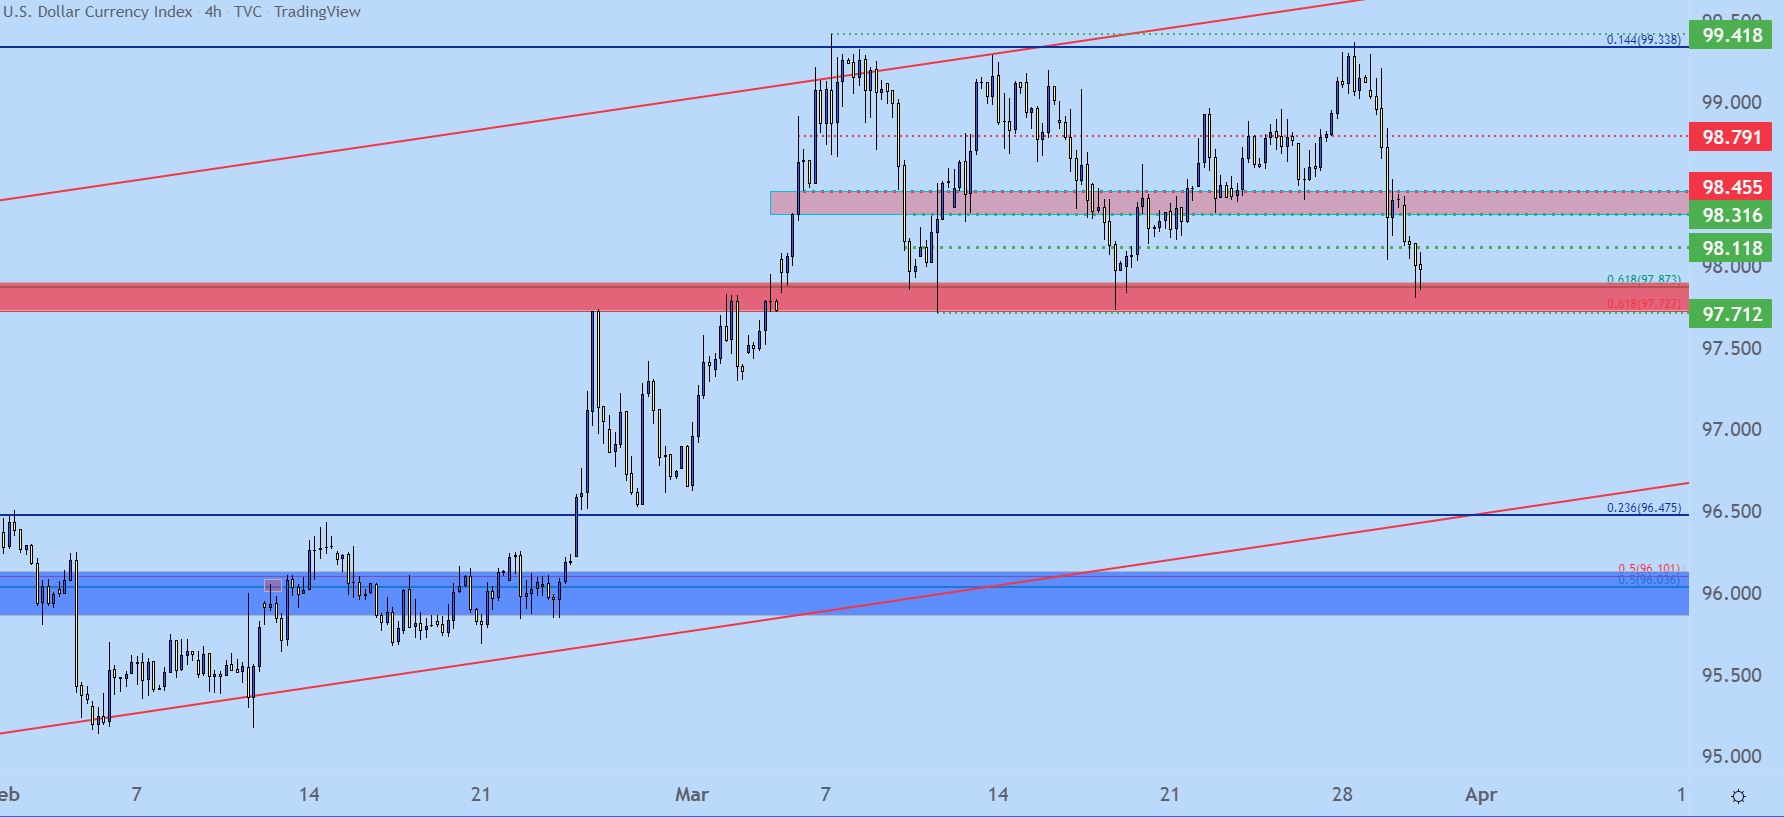
Chart prepared by James Stanley; USD, DXY on Tradingview
EUR/USD Pullback
As I looked at last week there was a couple of different setups showing in EUR/USD, with both a bullish and bearish formation showing. The bearish side started to show promise, with the rising wedge giving way as price retreated to support around 1.0958.
And then nothing happened… bears stalled, and that remained for about four days. I even tweeted that bears failing to take advantage of the move had opened the door for pullback potential, which is what’s started to show over the past couple of days.
EUR/USD is now trading at a fresh high after testing above the 1.1140 spot of resistance. I remain bearish longer-term on the pair, but until this short-term theme of strength shows signs of reversing, there’s continued topside potential in EUR/USD.
The zone that seems attractive at this point is a longer-term item running from 1.1187-1.1212, and beyond that is a key swing near the 1.1250 psychological level that could function as a deeper spot of resistance potential for longer-term bearish approaches, and short-term bullish outlooks.
EUR/USD Four-Hour Price Chart
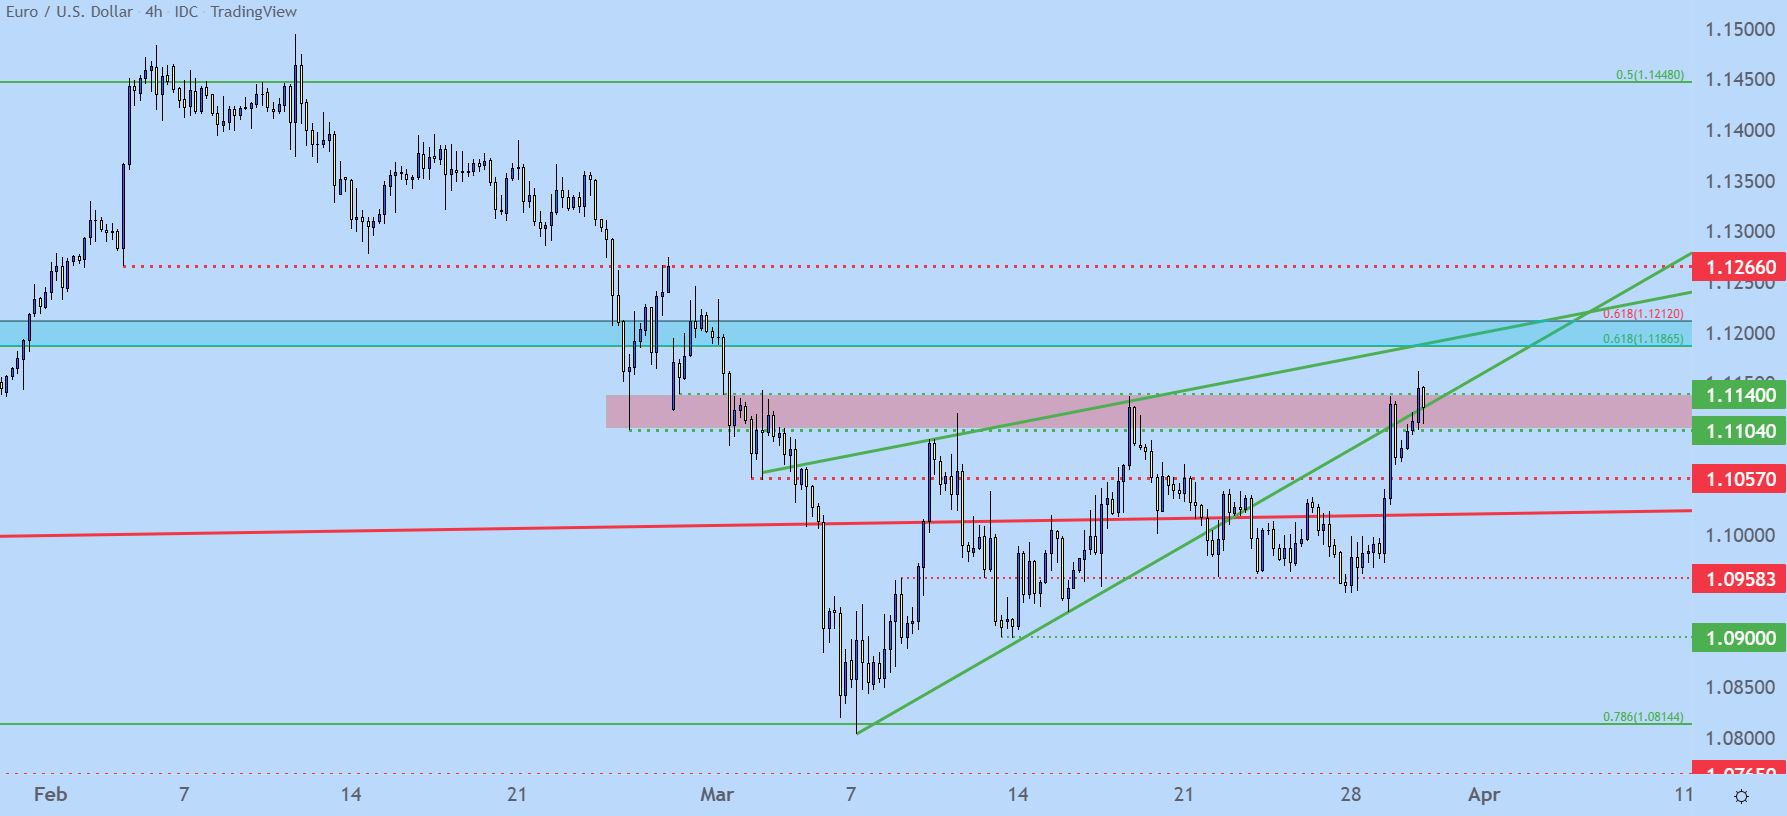
Chart prepared by James Stanley; EURUSD on Tradingview
GBP/USD
By mid-month I started looking for pullback or possibly even reversal scenarios in GBP/USD. The thesis was largely based on a test and hold of the 1.3000 psychological level in a pair that was supported by rate hike potential from the representative central bank.
And while that theme worked beautifully for about a week, with cable putting in a near- 300 pip incline and running up to a spot of resistance at prior support. But, that theme broke down on Monday as GBP/USD broke-back to the 1.3100 level after having traded around 1.3300 in the prior week.
So, at this point I remain cautiously optimistic of upside potential, largely on the basis of continued defense of 1.3000. But, the fact is that buyers were unable to push the bounce beyond prior support and the price action structure remains as bearish here.
That could potentially change and perhaps quarter-end is where it starts to happen. But, at this point, the daily chart is working on a non-completed morning star formation which, if completed, would also be a higher-low from the earlier March inflection at the 1.3000 psychological level. This could keep the door open for another test of resistance around the 1.3300 spot which, if it yields, could then open the door for stronger upside and a bigger picture reversal theme.
GBP/USD Daily Price Chart
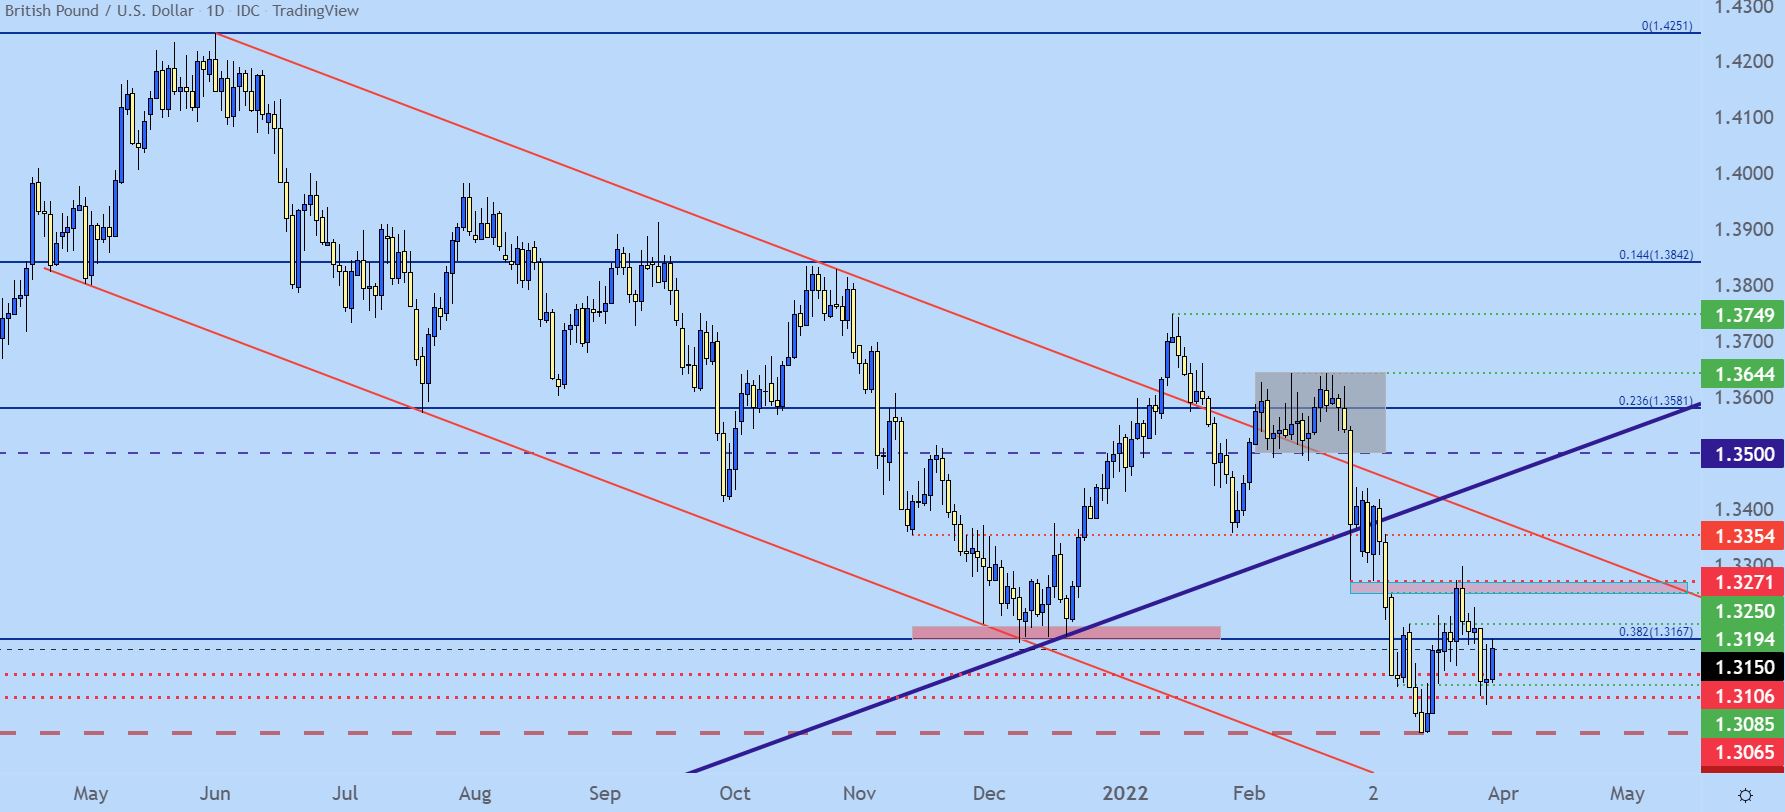
Chart prepared by James Stanley; GBPUSD on Tradingview
USD/JPY: Whoa
When rates become the focus, the Yen will have a tendency to move, and that was on full display this month as JPY put in some historic-like moves in a number of currency pairs.
I had looked into this theme in early-March, ahead of the breakout, honing in on the JPY as a risk vehicle in FX that could bring in some exposure to risk on/off themes.
Within a couple of weeks USD/JPY had exploded higher, setting a fresh six year high and testing above the psychological level at 125.00 briefly to start this week. But, that’s when the pullback began to show and that’s held through approximately 383 pips so far this week, with prices finding support around the 121.41 spot.
From the monthly chart, it’s clear that a major zone is in-play here, around 20-year highs in the USD/JPY pair.
USD/JPY Monthly Price Chart
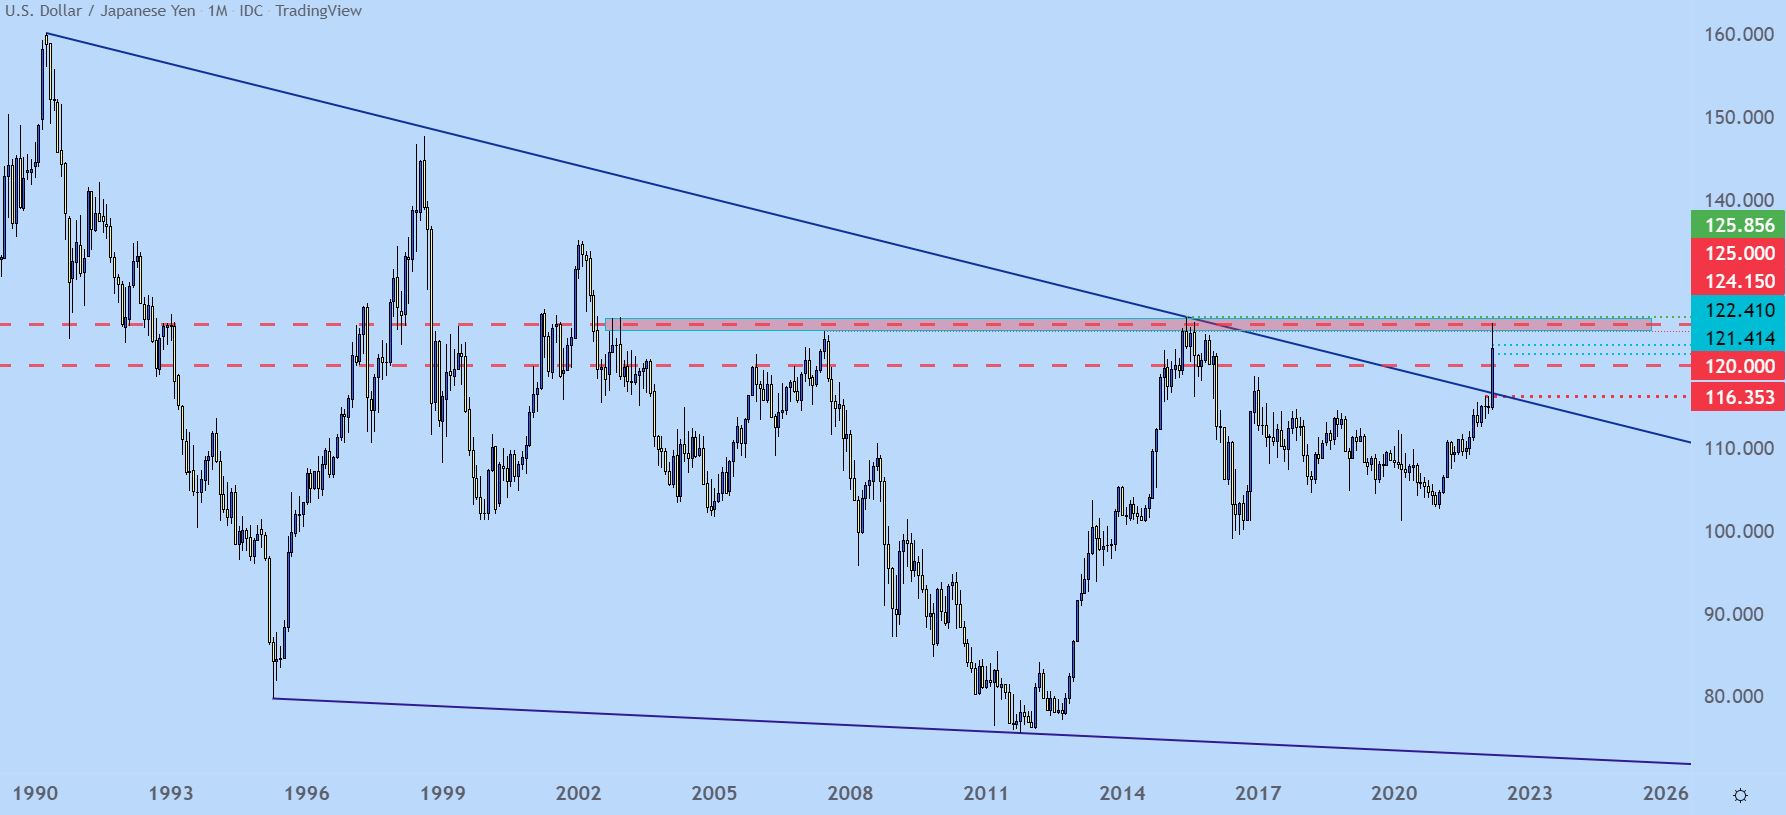
Chart prepared by James Stanley; USDJPY on Tradingview
USD/JPY Shorter-Term
When volatility increases the magnitude of swings on either side of the matter can also increase. A 383 pip move in USD/JPY a month ago would seem a game-changer. But now, after the March breakout that saw USD/JPY tack-on more than 1,000 pips, 383 for a pullback isn’t as threatening and from the four-hour chart below, this even aligns with an area of possible support. I had shared these levels over Twitter yesterday and they’ve continued to hold today.
But, given that we’re at quarter-end and that this was a massive move, there could be a deeper pullback and the spot around 120.00 which aligns with the 50% retracement of the major move in March seems an attractive spot of deeper support potential, if it does come into play.
For right now, we’re holding support at prior resistance, around the 38.2% retracement of the recent major move.
USD/JPY Four-Hour Price Chart
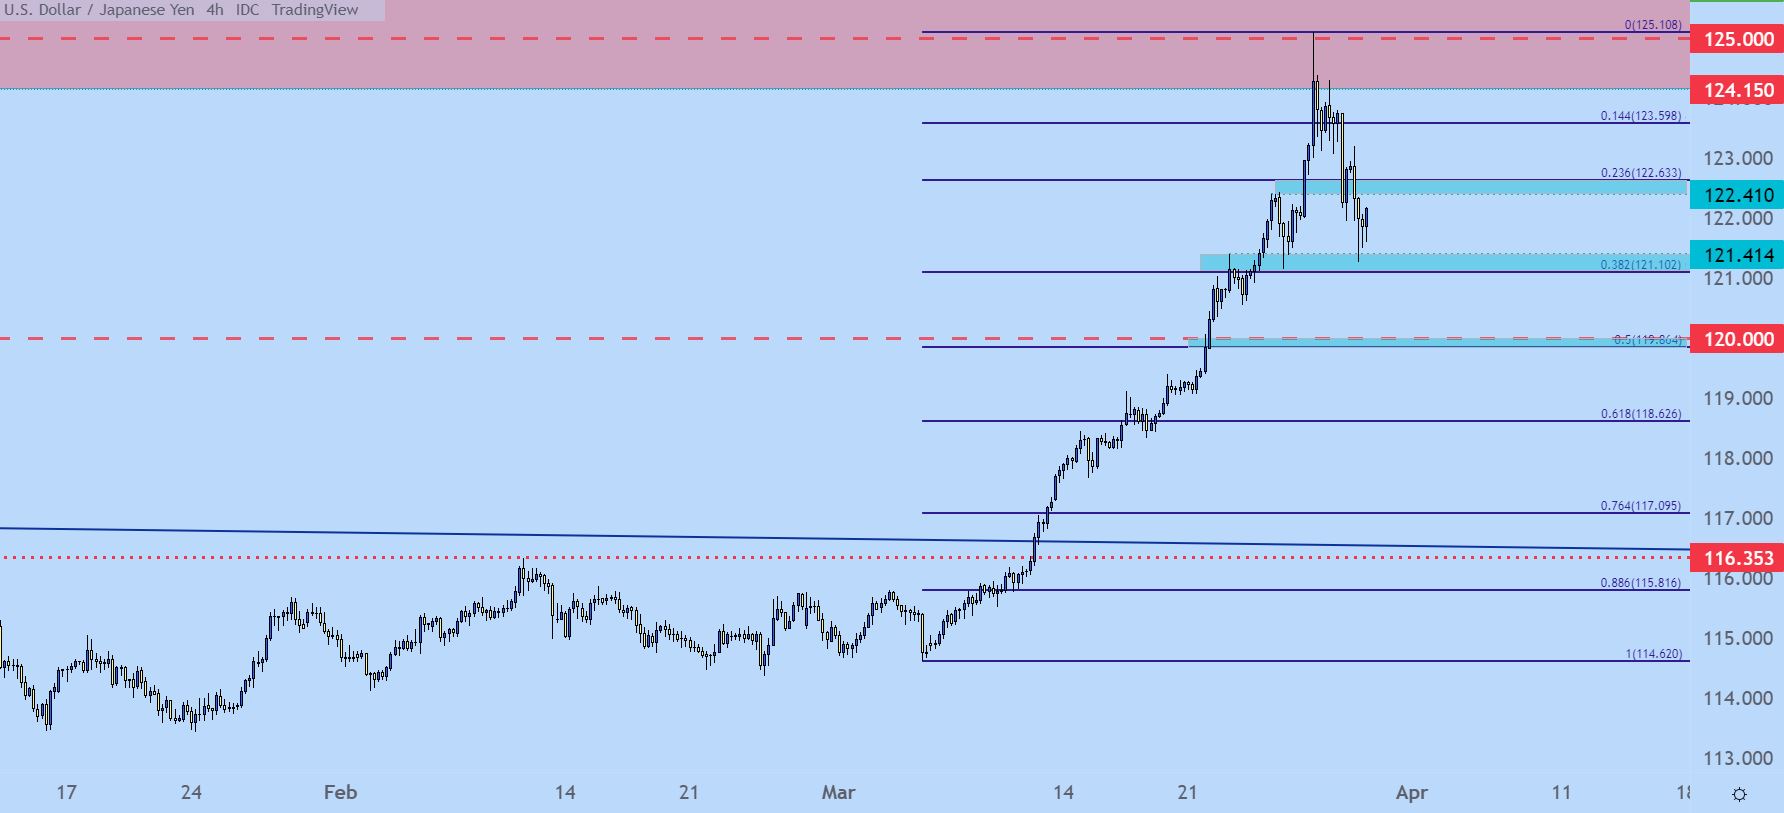
Chart prepared by James Stanley; USDJPY on Tradingview
USD/CAD Breakdown
USD/CAD is in the process of setting a fresh 2022 low as of this writing, but perhaps more importantly for the long-term structure, the bullish backdrop produced by the ascending triangle in-place since last summer has been negated.
Much of the recent hastening in price action has posted after the FOMC rate hike, so perhaps this is a jostling of expectations for rate divergence between the Fed and the BoC; but it’s interesting to note how CAD-strength has picked up to go along with this recent pullback in the USD.
From a longer-term perspective, there’s support potential at 1.2070 which has helped to hold the lows in USD/CAD since May of 2015.
USD/CAD Monthly Price Chart
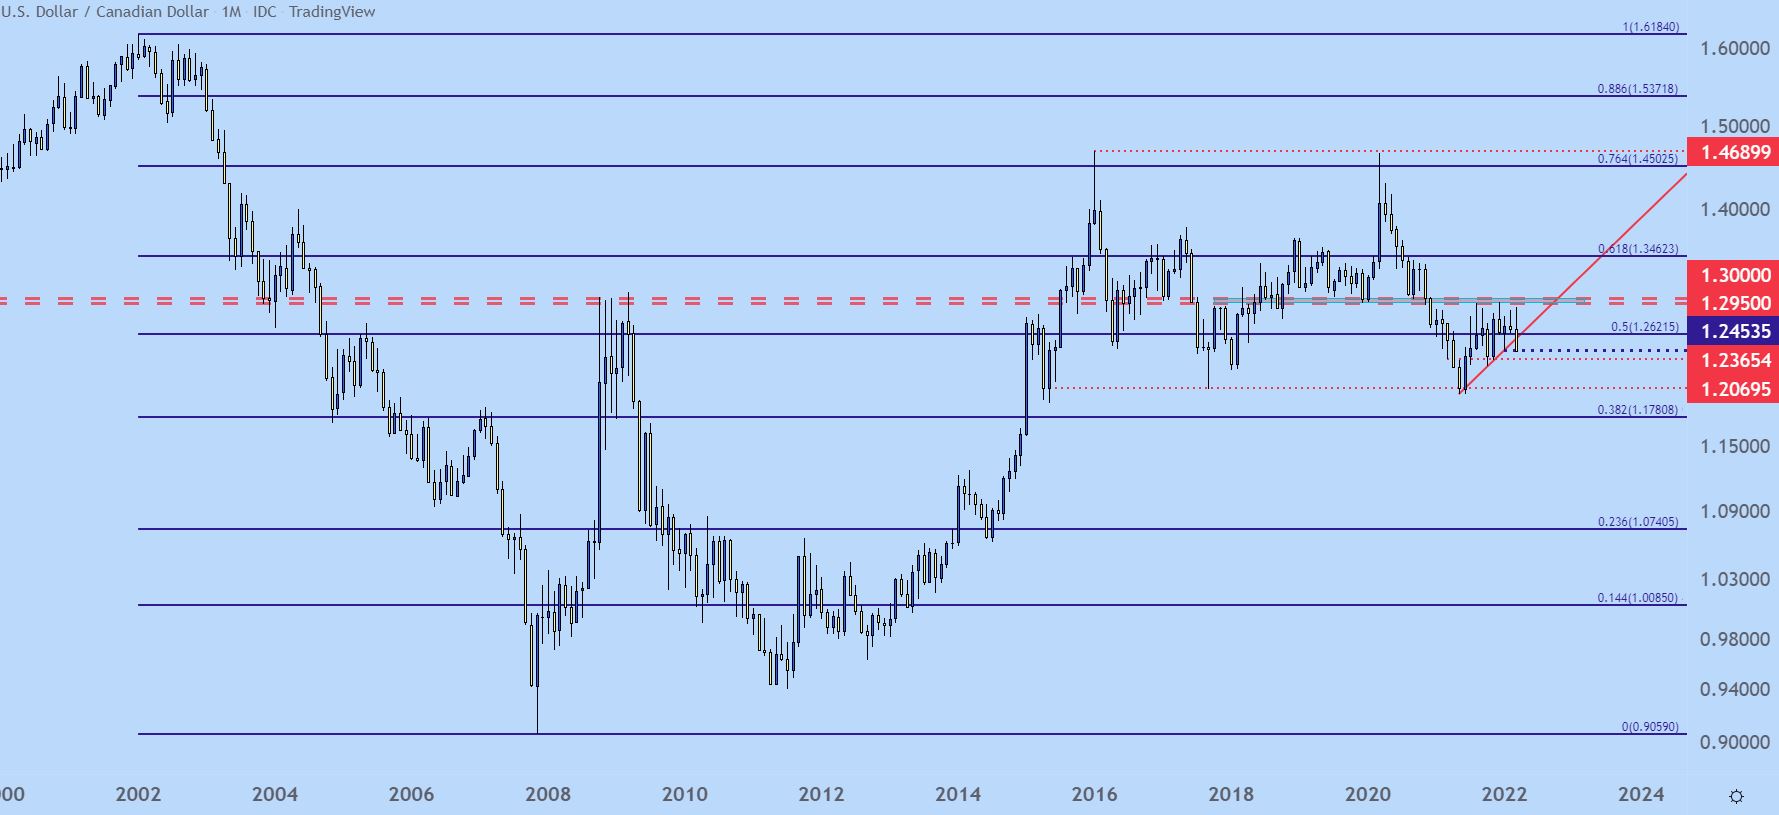
Chart prepared by James Stanley; USDCAD on Tradingview
--- Written by James Stanley, Senior Strategist for DailyFX.com
Contact and follow James on Twitter: @JStanleyFX


