

For a year in which the USD spent much of the outing in a range, it was a great year for US Dollar volatility.
The currency came into 2021 with a full head of steam in the bearish trend. A major level had come into play around the 90.00 handle, which was confluent with a Fibonacci level plotted at 89.92. This is the 38.2% retracement of the 2001-2008 major move. It stalled the sell-off in December 2020 and as the door opened into 2021, a continued grind at this level in January led to a lift in February and March.
That lift was very much driven by the prospect of the reflation trade, punctuated by hope that vaccines would bring on an eventual end to Covid and allow us all to go back to living our lives. Well, that didn’t happen, and in Q2 that bullish flare deflated in the USD and price action made a trip right back to 89.92 Fibonacci support, which held the lows in May.
Another lift began to develop ahead of the Q4 open, however, as the Fed finally started to signal a higher rate regime on the way, largely in response to inflation that still hasn’t tamed. This drove price action all the way up to the 38.2% retracement of that same major move, and as we sit just a couple of weeks away from New Year’s Day, 2022, that price is helping to hold near-term support in the USD.
US Dollar Index (DXY) – Monthly Timeframe (2001 to Present)
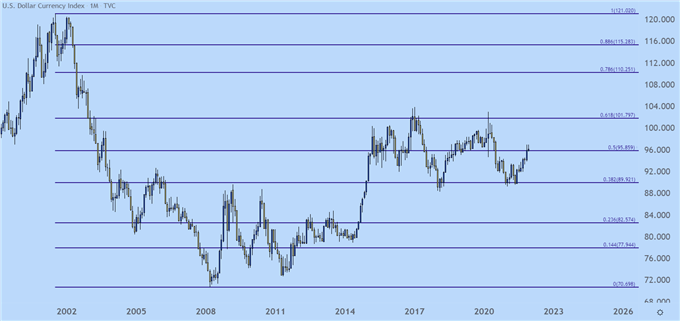
Source: TradingView; Prepared by James Stanley
USD Breakout Runs to a Big Zone – and Holds
That bullish theme in the US Dollar was very loud in Q4, and it even got its start ahead of the actual open. As I had highlighted in the Q4 forecast, there was an ascending triangle formation in the US Dollar, which pointed to bullish breakout potential.
That breakout hit shortly after the September FOMC rate decision, the point at which the bank started to forecast rate hikes for next year. That gave the initial break but what seemed to do a lot of the pushing was inflation data that just continued to grow throughout the quarter. This drove the USD up to a fresh 2021 high until, eventually, price action found a confluent zone of Fibonacci levels running from the 38.2% retracement looked at above, up to the 96.47 level, which is the 23.6% Fibonacci retracement of the 2017-2018 major move.
That price was also the final target from the Q4 technical forecast and as we near the 2021 open, and it’ll likely remain in the picture as we move into 2022 trade.
From the weekly chart we can see where price action put in a series of dojis near that confluent spot on the chart. That’s a massive amount of indecision after a really strong run. Normally, a doji showing at a key resistance level after a really strong run would favor pullbacks, but the fact that price hasn’t pulled back yet despite multiple weeks of equalized price action in this tight area is, in and of itself, deductively bullish. That means that there are buyers defending the line-in-the-sand, and this is one of the reasons that the Q1 Technical Forecast for the US Dollar is set to bullish.
Timing that theme may be a challenge, however, as a pullback cannot be ruled out. The question then is, even if a pullback does show, is it likely to unsettle the bigger picture trend? I don’t believe that to be the case, and there’s even an ideal area for that pullback to move towards, and this would be the 38.2% retracement of the 2020-2021 sell-off move. This was also a spot of resistance that came into play shortly after that Q4 breakout but, as yet this spot hasn’t been tested for support. A pullback to this level around 94.47 can keep the door open for continuation.
On the topside, breakout potential remains at the recent highs and how soon this shows will likely be determined by just how strong inflation data remains in early 2022 trade.
Dollar Index (DXY) – Weekly Timeframe (June, 2018- Present)
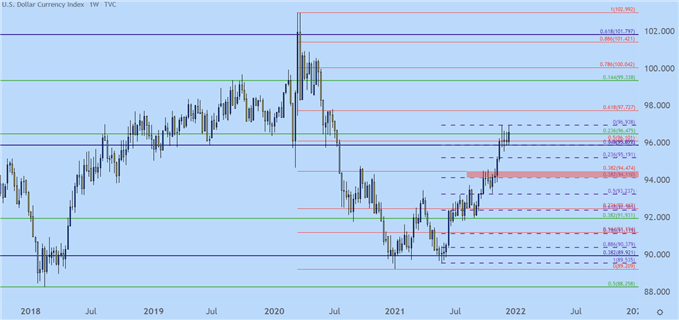
Source: TradingView; Prepared by James Stanley
Q1 2022 Forecast for the US Dollar: Bullish
The technical forecast for the US Dollar will remain at bullish for Q1, 2022. And the reasons for this aren’t entirely technical, as the fundamental backdrop is, in my opinion, too compelling to ignore.
A major part of the US Dollar price is the Euro, which constitutes more than 57% of the DXY quote. So when looking at USD projections it’s important to incorporate the Euro. And the divergence showing between the two economies seems too profound to allow for continued range.
But, as the USD ran into this major area of confluent resistance, EUR/USD has pushed down to a major area of confluent support – so the matter will likely need a push before fresh highs can be established in the USD or fresh lows in EUR/USD. I think this push can emanate in one of two ways: Either inflation in the U.S. remains so high that the trend breaks from fundamental driver. Or, the US Dollar retreats to support at 94.50 as EUR/USD pushes for resistance around 1.1448-1.1500, at which point the bigger picture trend can avail itself with USD-strength and EUR/USD-weakness.
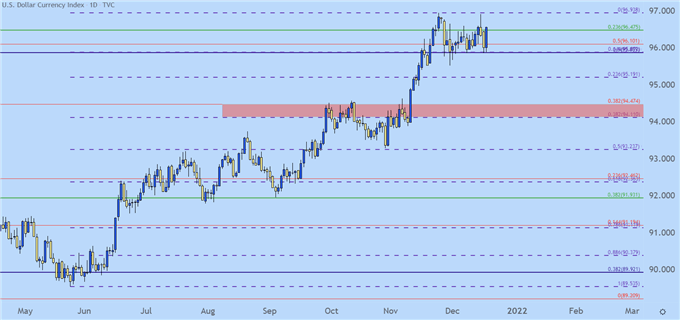
For support potential in USD, the 38.2% retracement of the recent bullish trend lines up at 94.11, and this can be combined with the 94.47 level to create a ‘zone’ of potential support to look to for bullish continuation scenarios.
Dollar Index (DXY) – Daily Timeframe (May, 2021- Present)