US Dollar, EUR/USD, GBP/USD, USD/CAD, USD/JPY Talking Points:
- The US Dollar is down on the day despite the earlier morning inflation print that came in at 5% for headline and 3.8% on core.
- Perhaps more notable than this morning’s inflation print is next week’s FOMC rate decision, the highlight of June’s economic calendar.
- The analysis contained in article relies on price action and chart formations. To learn more about price action or chart patterns, check out our DailyFX Education section.
We’re closing in on the end of what’s been a fairly busy week on the economic calendar. The charts, however, were relatively tame by comparison, leading some traders towards the assumption that summer trading conditions are here. But – a key thing to keep in mind is the looming FOMC rate decision for next week which, logically, dictated how this week’s data flow was received.
Next Wednesday’s rate decision is a big one, as it’s a quarterly meeting and the Fed will be furnishing updated projections and forecasts in the Summary of Economic Projections. This will highlight just how optimistic the bank is around economic conditions and perhaps more importantly, their take on inflation following this mornings 5% read on headline CPI.
To learn more about the Federal Reserve, check out DailyFX Education
At this point, the Fed has been saying that they consider recent inflation trends to be transitory which highlights the fact that they may not be too hurried in looking to temper those inflationary forces. This has kept stock markets churning higher as the US Dollar has remained pinned down near an area of long-term support. That support grind in the Greenback continued this morning through CPI, with the USD putting in a quick check of the 90.00 level before bouncing higher.
US Dollar Hourly Price Chart
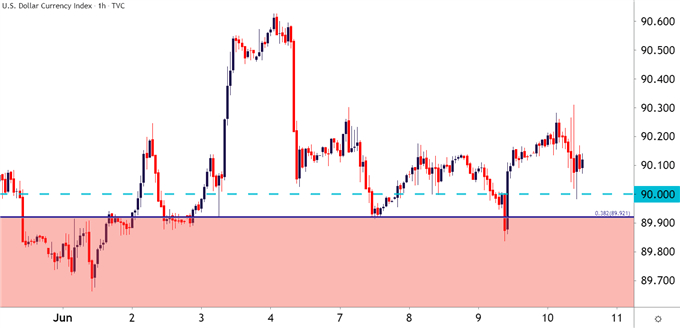
Chart prepared by James Stanley; USD, DXY on Tradingview
Taking a step back on the chart and we can see what a critical area of support this is in the longer-term backdrop of the US Dollar. This is the same zone that came into play in Q1 to hold the lows before prices ripped in March. The first two months of Q2 were very bearish in USD, until this zone came into play, that is, and prices have since stalled.
US Dollar Monthly Price Chart: Big Support Zone In-Play
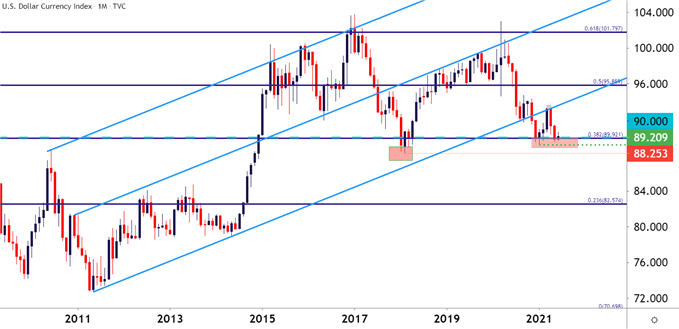
Chart prepared by James Stanley; USD, DXY on Tradingview
EUR/USD: Holding Support After ECB
There was an ECB rate decision this morning. It was somewhat eclipsed by the CPI release out of the US, however, and the EUR/USD pair didn’t put in much volatility around the statement. The press conference began right at 8:30, the same time as the CPI release, so it can be difficult to determine which event had more pull here but, on net, there wasn’t much pull in either direction as the pair is pretty much at the same spot as it was ahead of this morning’s events.
EUR/USD Hourly Price Chart
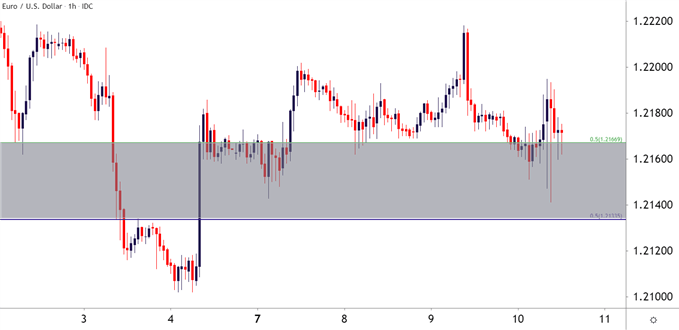
Chart prepared by James Stanley; EURUSD on Tradingview
Taking a step back on the chart and there could be a continued bullish case to be made here. I had outlined this in last week’s Analyst Pick, looking for EUR/USD to hold above the bottom-portion of the 2134-2167 support zone.
That happened after the Monday open and another instance showed up again this morning around the ECB/CPI drivers. The fact that buyers have held this support zone throughout the week keeps the door open for topside scenarios in the pair.
EUR/USD Four-Hour Price Chart
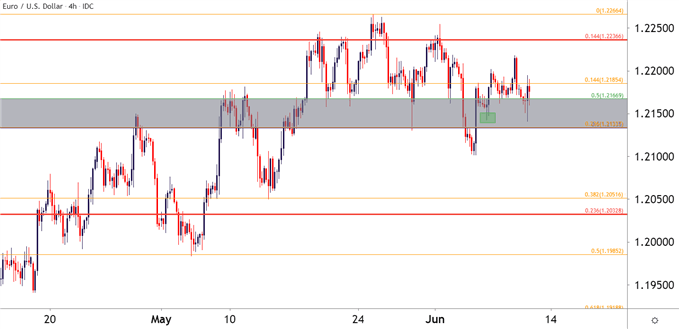
Chart prepared by James Stanley; EURUSD on Tradingview
GBP/USD Holds the Range
As I had also shared in that Analyst Pick, GBP/USD remained attractive from a similar vantage point, albeit perhaps a bit more attractive than EUR/USD for topside strategies given last week’s price action.
That range continued into this week and this morning’s theatrics allowed for yet another support test of the 1.4098 area that’s been in-play for a few weeks now.
If we do end up with USD-weakness around next week’s FOMC rate decisions, GBP/USD may soon trounce up to fresh three year highs, and if that can be taken-out, the post-Brexit high rests just a little higher on the chart, around 1.4377.
GBP/USD Four-Hour Price Chart
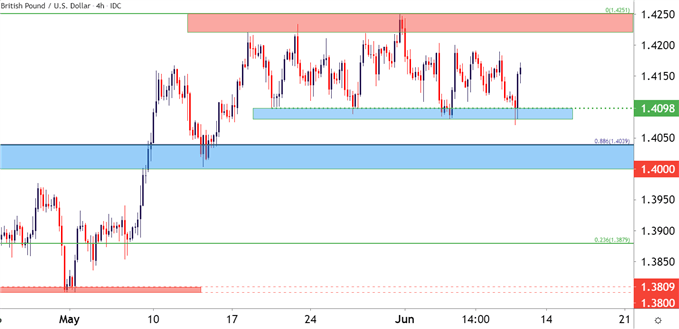
Chart prepared by James Stanley; GBPUSD on Tradingview
USD/CAD Holds Support Through BoC, CPI – Focus to the Fed
It was an especially busy week in USD/CAD although that hasn’t really reflected in the pair’s price action. The Bank of Canada hosted a rate decision on Wednesday and after the BoC’s April outing, attention was focused on whether there’d be a deeper tapering of QE purchases or perhaps even a hat tip towards future policy normalization.
But, after that April outing when the BoC became one of the first central banks to turn their attention towards post-pandemic policy, the Canadian Dollar remained really strong for a month after, and USD/CAD pushed all the way down to fresh six-year-lows.
At Wednesday’s rate decision, the BoC was considerably more careful and USD/CAD bears didn’t really get any information to work off of for further lows.
At this point, the 1.2000 level looms large: The psychological level came into play last week as sellers pulled up short of a test at the big figure, instead, leaving a swing-low at 1.2002.
To learn more about psychological levels, check out DailyFX Education
If the Fed remains very dovish next week and this would likely be transmitted by the dot plot matrix with no hikes expected until 2024; but this could give the pair further motivation as divergence would still exist between stances at the FOMC and the BoC. Something of that nature may finally give a 1.2000 break but, until then, the pair is vulnerable to squeeze scenarios after a really decisive bearish run.
USD/CAD Four-Hour Price Chart
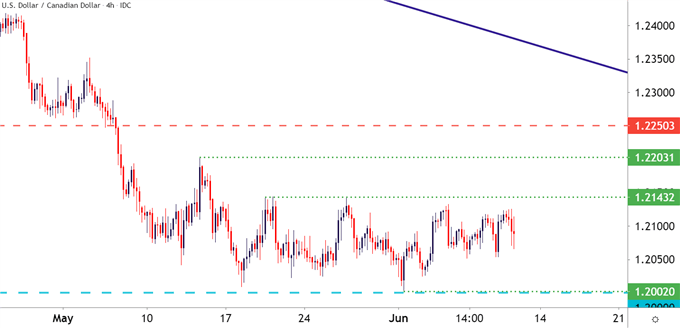
Chart prepared by James Stanley; USDCAD on Tradingview
USD/JPY for USD-Strength Scenarios
If there is some signal from next week’s FOMC that policy may be soon nudged to ‘less loose,’ USD/JPY could remain interesting. The pair popped-higher in Q1 as the Dollar-strength theme was running strong. And more recently, as USD has grinded around support ahead of next week’s FOMC, USD/JPY has taken on a short-term bullish trend into the 110 handle.
That psychological level has remained resistant and buyers have yet to leave it behind; but if we do end up with a strong-USD in response to next week’s FOMC, this can quickly become an area of interest again, similar to last quarter.
USD/JPY Daily Price Chart
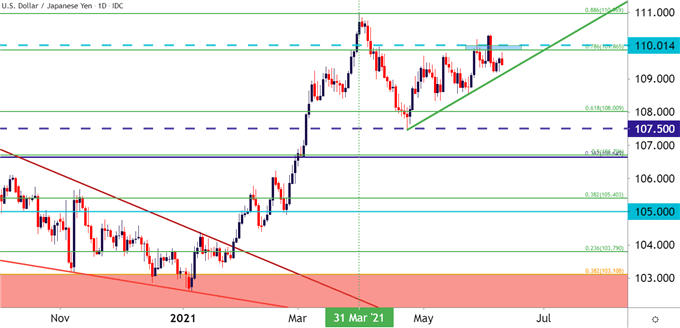
Chart prepared by James Stanley; USDJPY on Tradingview
--- Written by James Stanley, Senior Strategist for DailyFX.com
Contact and follow James on Twitter: @JStanleyFX


