Crude Oil Price Forecast Talking Points:
- Oil prices enjoyed an aggressively bullish run in the wake of the US Presidential Election.
- CL futures jumped by more than 100% from the November low to the March high.
- After setting a fresh two-year-high on March 8th, prices have started pulling back. More recently, that pullback has taken on more aggression, highlighting the potential for reversal potential from a strong topside move.
- The analysis contained in article relies on price action and chart formations. To learn more about price action or chart patterns, check out our DailyFX Education section.
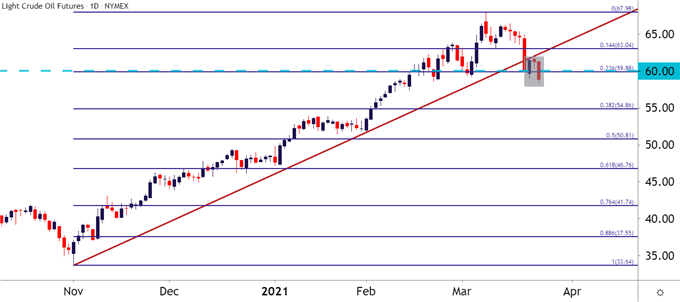
A number of risk assets put in strong major moves starting around the US Presidential Election last November. While much of the attention has been on crypto or Gamestop or NFTs for this recent phenomenon, oil prices have put in a pretty strong trend of their own. Crude oil futures set a low on the day of the election around $33.64. Earlier this month and just a bit more than four months after that low, Crude Oil futures hit a fresh two-year-high at 67.98, a full 102% away from that low set last year.
That move put in an initial pullback of 14.4%, at which point a bit of support showed up. But buyers were unable to re-test the highs and since then support has continued to slide lower. Last Thursday was particularly notable, in the wake of the FOMC rate decision, when Crude Oil prices pushed below a bullish trendline that had been in-place since that November low.
Now, after the Friday bounce led into a spinning top yesterday, with another bearish push this morning – there’s the potential for an evening star pattern on the Daily chart. Evening star formations will often be approached with the aim of bearish reversals, and given where that spinning top showed up yesterday, the door would appear to be opening for a deeper push in Crude Oil prices.
To learn more about the Evening Star Formation and why it’s approached for bearish reversal potential, check out DailyFX Education
Crude Oil Daily Price Chart (CL1)

Chart prepared by James Stanley; CL1 on Tradingview
Crude Oil Testing Below Key Support
Perhaps more important than the possible formation looked at above is the area on the chart where all of this is taking place.
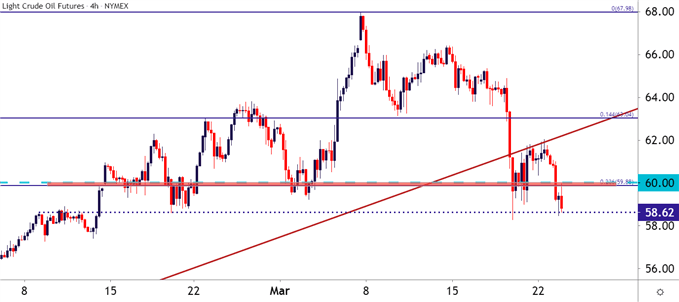
Crude oil prices are testing below a key spot of confluent support running from $59.88-60.00. The former of those prices is the 23.6% Fibonacci retracement of the November-March major move, while the latter of those prices is a major psychological level.


On a shorter-term basis, we can see where this confluent zone has recently start to show as short-term resistance; and near-term support is coming in around a group of swing-highs from early-February. This chart presents short-term breakdown potential as the longer-term bullish trend further pulls back.
To learn more about Fibonacci or psychological levels, join us in DailyFX Education
Crude Oil Four-Hour Price Chart (CL1)

Chart prepared by James Stanley; CL1 on Tradingview
Crude Oil Prices Longer-Term
Taking a step back in order to put the short-term setup into context, and there could be even more motive for a deeper pullback or a possible reversal.
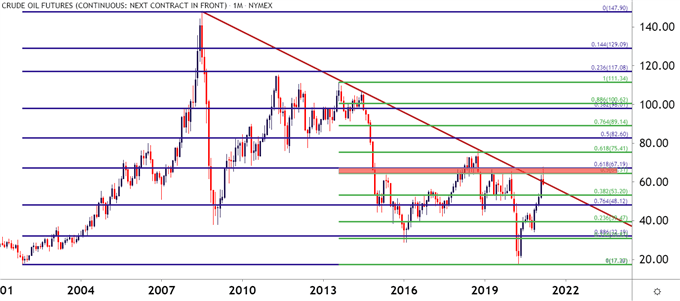
Please note, the below chart and related analysis is based off of the CL2 price feed, in order to work around the sub-zero move that showed up last April. The rapid price jump seen from the November low ran into the 61.8% Fibonacci retracement of the 2001-2008 major move at $67.19. Nearby is the 50% marker of the shorter-term major move spanning from the 2013 high down to the 2020 low. That plots at 64.31 and along with the above level, creates a confluent Fibonacci zone of resistance that had some pull on the matter back in 2019.
Given the possibility of pullback in the longer-term trend and the potential for reversal of the shorter-term trend, the door would appear open to deeper breakdown potential in crude oil prices.
Crude Oil Monthly Price Chart (CL2)

Chart prepared by James Stanley; CL2 on Tradingview
--- Written by James Stanley, Strategist for DailyFX.com
Contact and follow James on Twitter: @JStanleyFX


