


Gold Price Forecast Talking Points:
- Gold prices remain in a falling wedge pattern that’s been building for more than two months.
- Ahead of this recent digestion, Gold prices were breaking out with aggression, setting a fresh all-time-high in early-August. Are bulls waiting to drive that next break?
- The analysis contained in article relies on price action and chart formations. To learn more about price action or chart patterns, check out our DailyFX Education section.
Last week saw Gold prices tease a bullish breakout. But, buyers stepped back before a re-test of the prior October high and, so far, Gold prices have continued in the digestion backdrop that’s become commonplace over the past two months.
As looked at last week, Gold prices remain in a falling wedge pattern after the bullish breakout drove through the August open. This isn’t the first time that Gold prices have formed a falling wedge during this recent bullish cycle, as similar scenarios presented itself in Feb-May of last year and then again from September-December. Such formations will often be approached with the aim of bullish breakouts, begging the question as to whether or when buyers might be ready to resume the bigger picture trend in the yellow metal.

To learn more about falling wedges, check out our DailyFX Education section.
Gold Daily Price Chart
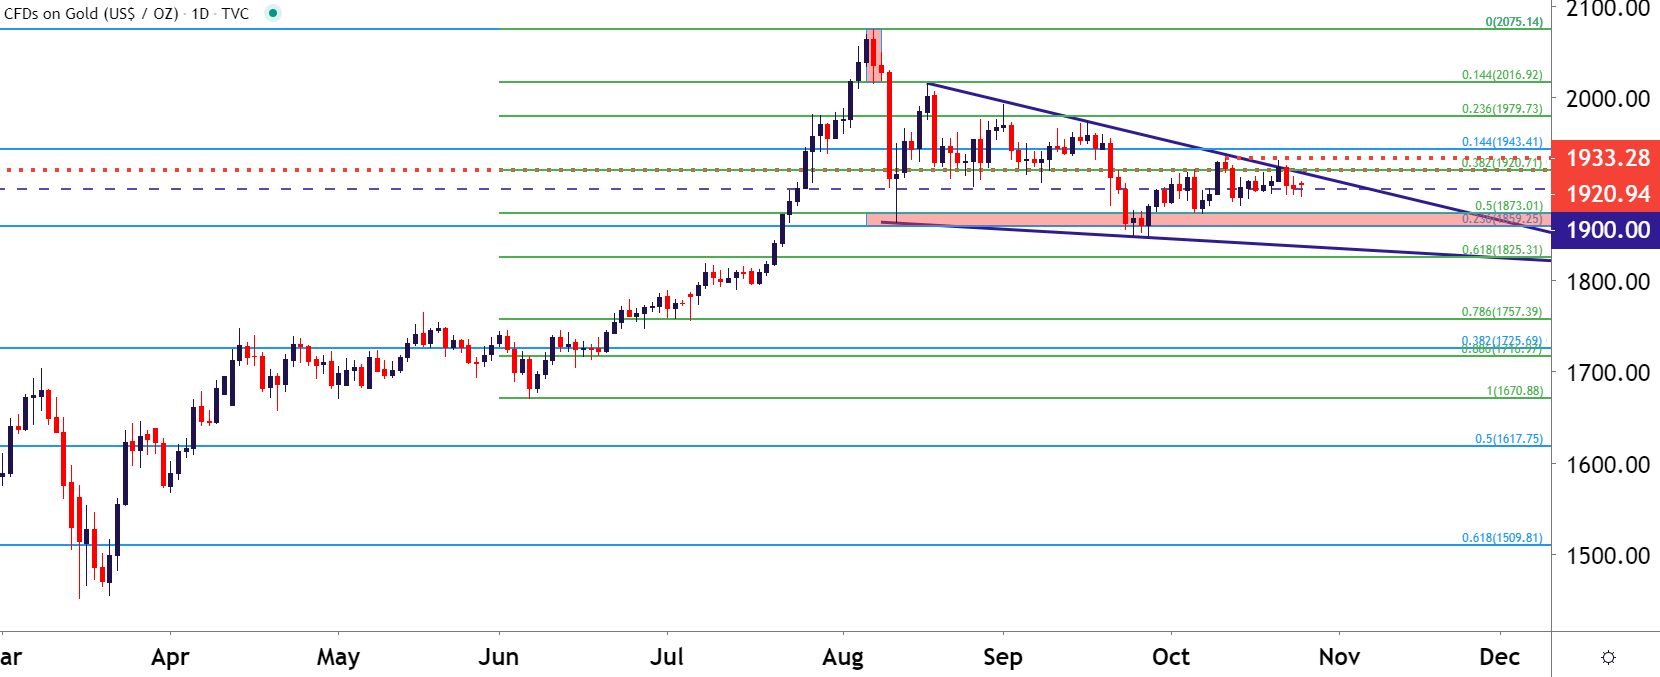
Chart prepared by James Stanley; Gold on Tradingview
Gold – Deeper Support Potential
On a shorter-term basis, there could be scope for a deeper pullback while that longer-term wedge remains in-play. Price action in Gold appears to be slipping below the bottom-side of the 1900-1920 zone, and underneath price action is another area of possible support running from 1859-1871. This zone is what helped to catch the low in early-August, and came back into play in late-September. Prices in Gold could dip down to this zone while still remaining above the September swing-low; setting the stage for another run at resistances of 1900, 1920 and eventually 1933 (the October swing-high).

Gold Four-Hour Price Chart

Chart prepared by James Stanley; Gold on Tradingview
--- Written by James Stanley, Strategist for DailyFX.com
Contact and follow James on Twitter: @JStanleyFX


