


US Dollar, USD, EUR/USD, AUD/USD Talking Points:
- USD bears are back after a two-day pullback in the bearish theme.
- This week’s economic calendar brings NFP and jobs numbers are deserving of intense focus right now.
- The USD is approaching the 92.50 zone, which helped to hold the lows last week. Support or a reversal here puts AUD/USD in an interesting spot for reversals. A bit deeper, around the 92.00 handle on DXY is another zone of potential support, and an inflection there pushes the focus on EUR/USD and what might happen in the pair after a test of the 1.2000 psychological level.
US Dollar Bears Make a Re-Appearance – Can The Bring on Fresh Lows?
USD bears are back at it again, after a two-day pullback ran into resistance on Monday afternoon. That resistance played-in around a prior area of swing support at 93.75, which had helped to set the lows on two separate occasions in July and then September of 2018. When the USD was dropping aggressively in late-July, this level didn’t appear to produce much for support but did help to stall the sell-off, albeit temporarily. That hard bearish theme continued, as shown on the below chart with the dashed maroon trend-line, and sellers remained in-control all the way into last Friday, which was the final day of July. That end-of-month theme brought a pullback, and the pullback ran into that resistance on Monday at which point sellers made a pronounced re-appearance back into the equation.

US Dollar Weekly Chart

Chart prepared by James Stanley; USD, DXY on Tradingview
The big question at this point is what happens around the 92.50 swing that helped to set support last week? If sellers can continue to push – there’s a big zone of possible support around the 92.00 handle in DXY, as there are two Fibonacci levels lodged in close proximity. The 23.6% Fibonacci retracement of the 2017-2018 major move and the 38.2% retracement of the 2011-2017 major move co-exist around that 92.00 level, and a push down here may possibly open the door to reversal themes in the USD, especially considering how oversold the currency has become so far in Q3.
US Dollar Monthly Price Chart
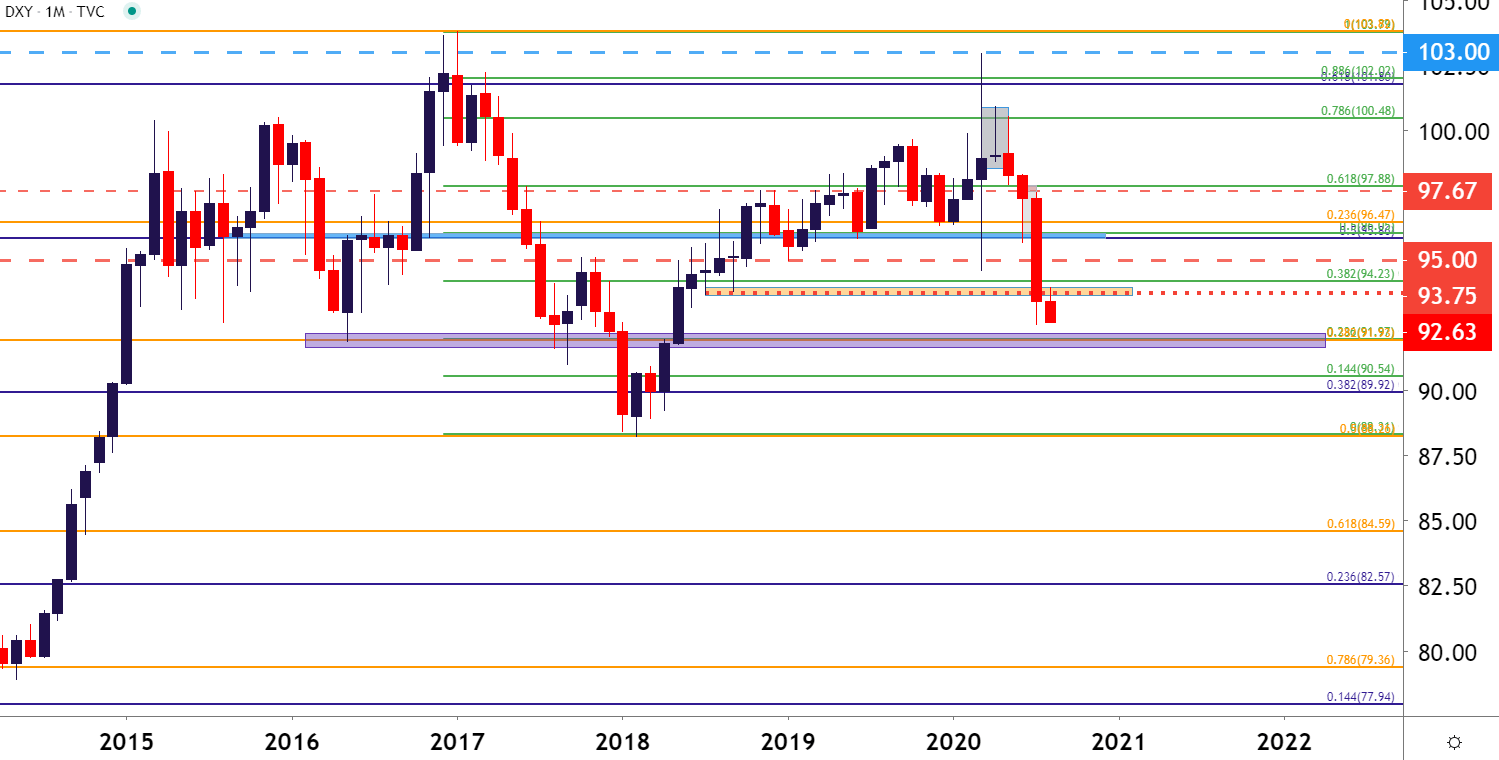
Chart prepared by James Stanley; USD, DXY on Tradingview
EUR/USD Strength on Display – but Can it Take Out 1.2000?
It’s been a brisk start to Q3 so far for the Euro, as EUR/USD came into the quarter testing a key zone of support around the 1.1212 Fibonacci level. But that support test turned out to be a trampoline-like bounce as the pair jumped through out last month and began to test the resistance size of a multi-year symmetrical wedge pattern.
EUR/USD Monthly Price Chart

Chart prepared by James Stanley; EUR/USD on Tradingview
At this point, the big hurdle sitting ahead for the pair is around the 1.2000 psychological level, which hasn’t been traded at in over two years. This level being tested seems to sync well with a 92.00 test on DXY; which could set up for an interesting scenario as an overbought EUR/USD and an oversold USD attempt to push the envelope above a major psychological level that hasn’t been in play for more than two years. But, on the long side of the coin, the bullish move in EUR/USD has recently pulled back, found support around prior resistance, and continued to trade higher, which does keep the door open for that 1.2000 test as higher-highs and higher-lows have continued, even amidst this overbought backdrop.
EUR/USD Daily Price Chart
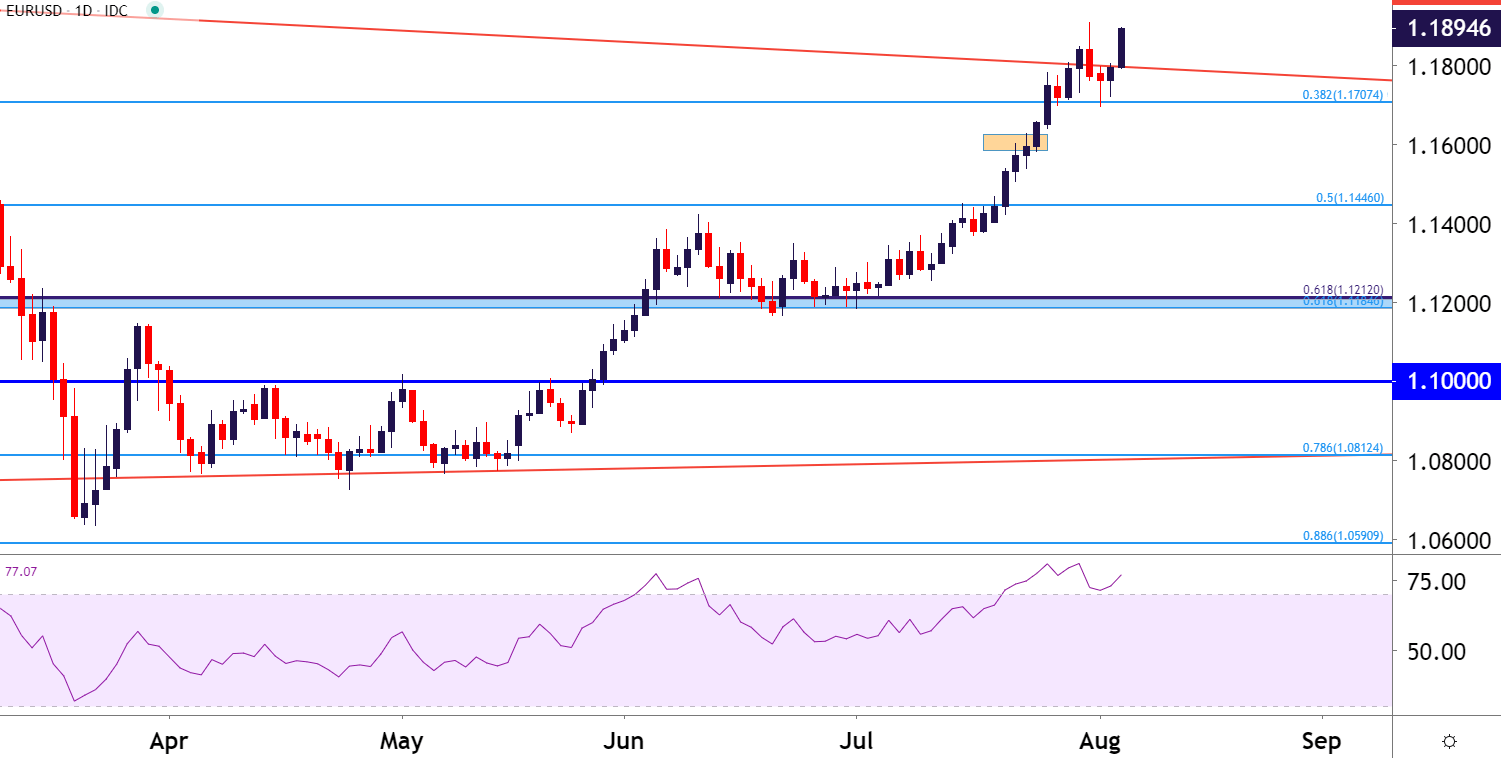
Chart prepared by James Stanley; EUR/USD on Tradingview
Aussie Launch Continues, AUD/USD Fresh Yearly Highs
AUD/USD has already set a fresh yearly high this morning, pushing above an area of resistance that had previously helped to hold bulls at bay. The Fibonacci level around .7185, connected up to the .7205 level, had helped to hold resistance in the pair for a couple of weeks. But buyers have continued to push the bid higher, amounting to this morning’s breakout with price action setting a fresh yearly high.

The big question here is what happens to USD when DXY tests that 92.50 zone that helped to set support last week. If we do get a support inflection in USD with a bit of a bounce, this could open the door for short-term reversal themes in AUD/USD, driven by the prospect of a false breakout.
AUD/USD Four-Hour Price Chart
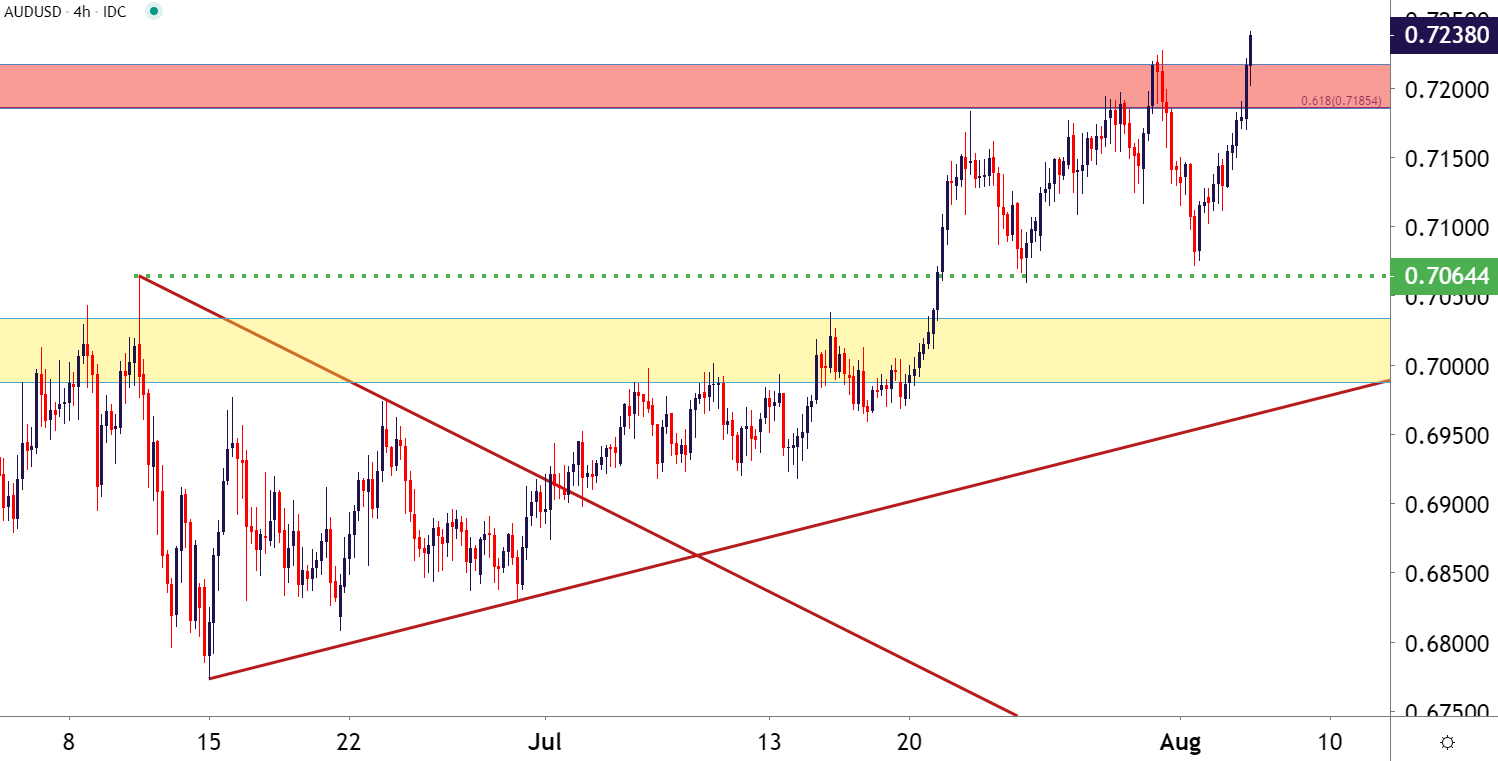
Chart prepared by James Stanley; AUD/USD on Tradingview
--- Written by James Stanley, Strategist for DailyFX.com
Contact and follow James on Twitter: @JStanleyFX


