


EUR, Euro, EUR/USD Price Analysis:
- Euro bulls have been on break over the past week.
- The previous bullish trend in EUR/USD has posed a 38.2% pullback to a key zone of support on the chart.
- As prices in EUR/USD have pulled back, a falling wedge has formed atop the prior trend, leading to the potential for bullish continuation scenarios should this long-term zone of support help to hold the lows.
EUR/USD Bullish Trend Pulls Back
The bullish theme in the Euro has run into some challenges over the past week, particularly in the EUR/USD pair as USD-strength has begun to show in the aftermath of last week’s FOMC rate decision.
After riding a smooth and consistent uptrend for a couple of weeks, EUR/USD began to pullback shortly after last week’s Federal Reserve rate decision. That pullback has been relatively tame thus far, as it’s retraced approximately 38.2% of that prior bullish trend. That retracement, however, lines up at a key zone on the chart that aligns with another Fibonacci level of relevance. Collectively, this zone of support has helped to hold the lows over the past two trading days.
EUR/USD Four-Hour Price Chart
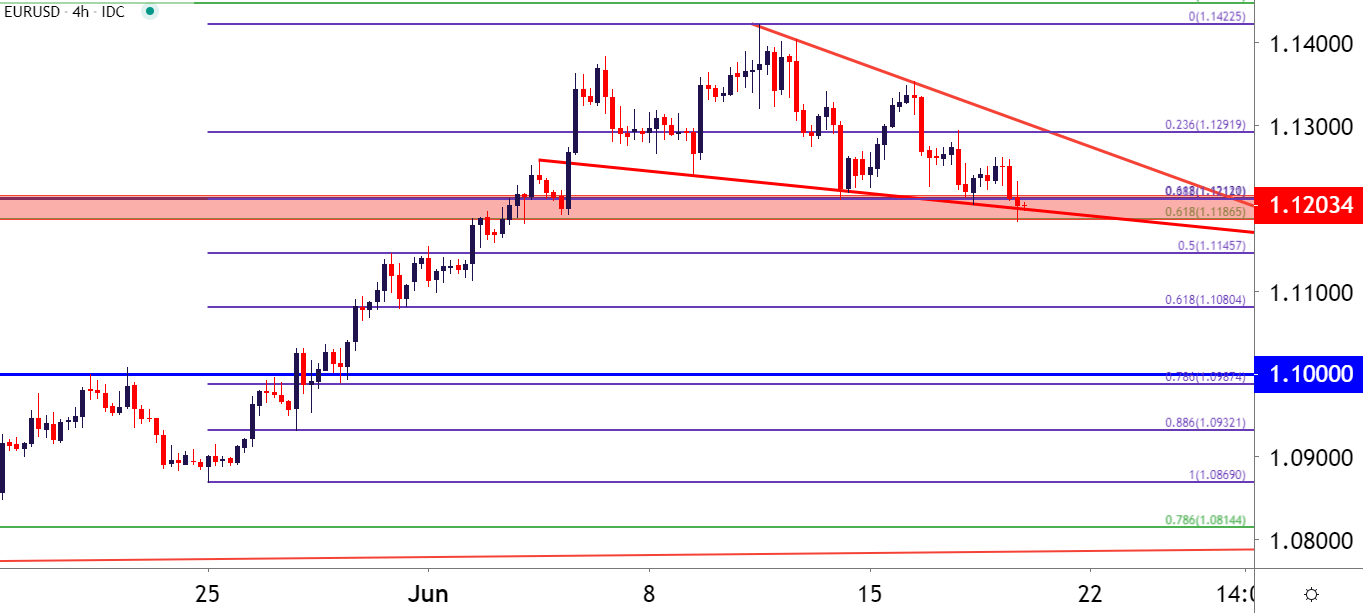
Chart prepared by James Stanley; EUR/USD on Tradingview
EUR/USD Re-Tests Key Zone as Falling Wedge Builds
The current zone of support has been tested multiple times over the past week; including an increasing frequency of tests over the past couple days as sellers persist. But this zone offers an element of confluence as there are number of support mechanisms plotted in a very tight range. As mentioned earlier, the 38.2% retracement rests at 1.1212. But there’s another relevant level at that same exact price as this is also the 61.8% retracement of the ‘lifetime move’ in the pair, taking the low from the year 1999 up to the 2008 high.
| Change in | Longs | Shorts | OI |
| Daily | -1% | -4% | -3% |
| Weekly | 4% | -10% | -5% |
This price of 1.1212 has produced numerous inflections over the past five years and continues to bring impact on near-term price action.
EUR/USD Monthly Price Chart
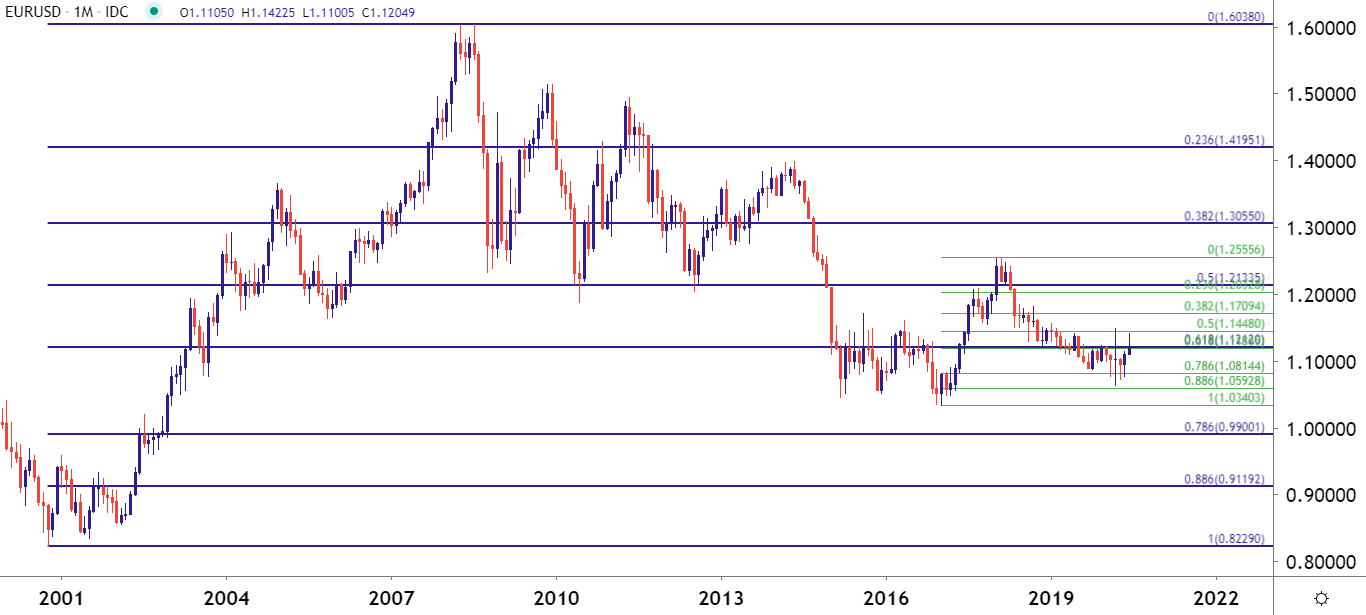
Chart prepared by James Stanley; EUR/USD on Tradingview
But also within this zone is another 61.8% retracement that plots at 1.1187, as this is derived from the 2017-2018 major move.
And as this zone has come into play over the past week, sellers have slowed down around tests of lows while remaining fairly aggressive around tests of lower-highs, leading to the build of a falling wedge formation. Falling wedges will often be approached with the aim of bullish reversals, driven by the logic that the horizontal support that’s begun to dissuade sellers around the lows may, eventually, lead to a cauterization of support that could entail a change in trend.

That hasn’t happened yet as sellers continue to drive. But, it does help to illustrate the importance of the current support zone; combined with the potential for this rising wedge near the top of recent price action to take on a tone similar to a bull flag formation; where a bullish trend poses a pullback before a stronger bullish move shows.
On the topside of price action, that same resistance zone that came back into play in March looms large. This runs from 1.1448-1.1500, and should buyers come in to re-take control, that could be the next level to monitor for price action to test.
EUR/USD Eight-Hour Price Chart
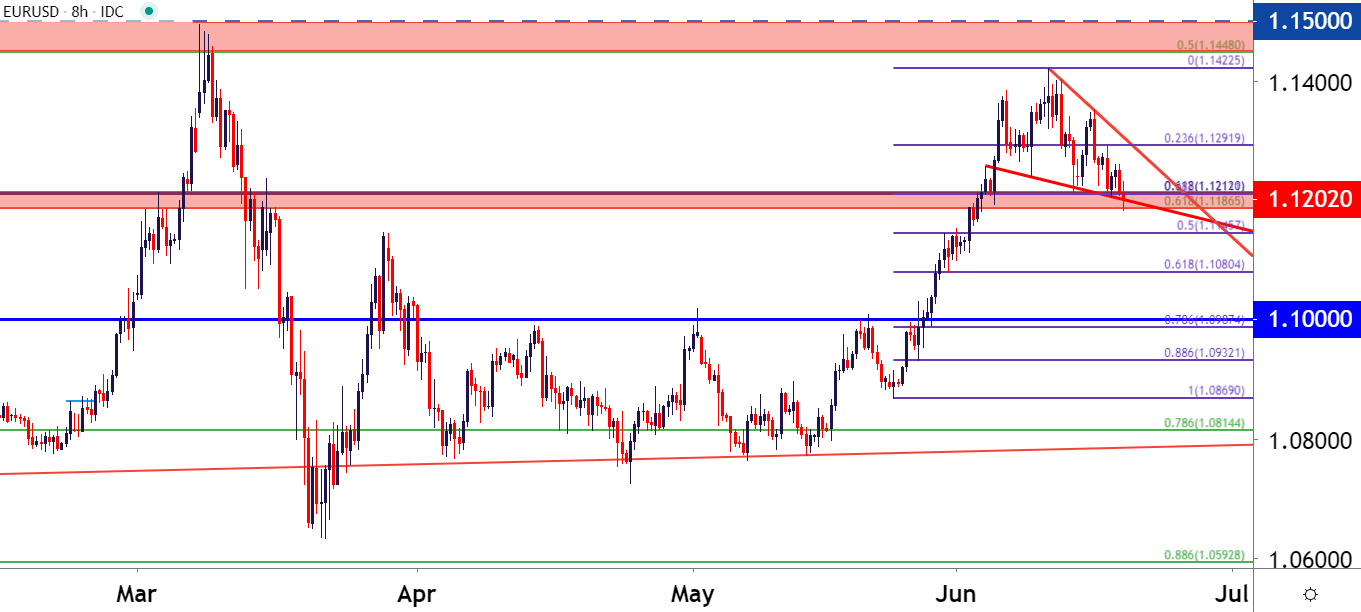
Chart prepared by James Stanley; EUR/USD on Tradingview
--- Written by James Stanley, Strategist for DailyFX.com
Contact and follow James on Twitter: @JStanleyFX


