


Gold Price Analysis
- Gold prices have been moving rather slowly thus far this week.
- Last week brought a quick rush of momentum in Gold after the FOMC rate decision, but this soon stalled when prices tested a key point of resistance.
Gold Prices Remain in Range, For Now
Gold prices have now been battling a key point of resistance for two months. This comes fresh on the heels of a 20% pop as the yellow metal surged following a support test at a very important area on the chart. That same area had helped to hold the lows in Q4 of last year and quickly came back into play in mid-March as Gold prices were spiraling-lower as the world prepared for fallout from shutdowns related to the coronavirus.

This fright brought a near -15% sell-off to Gold prices, until that support could come into play, at least; after which buyers came in and helped to push price action back-up to fresh seven-year highs just a few weeks later. Since then, however, little trend has shown as Gold prices have ranged back-and-forth between a couple of longer-term Fibonacci levels.
Gold Daily Price Chart
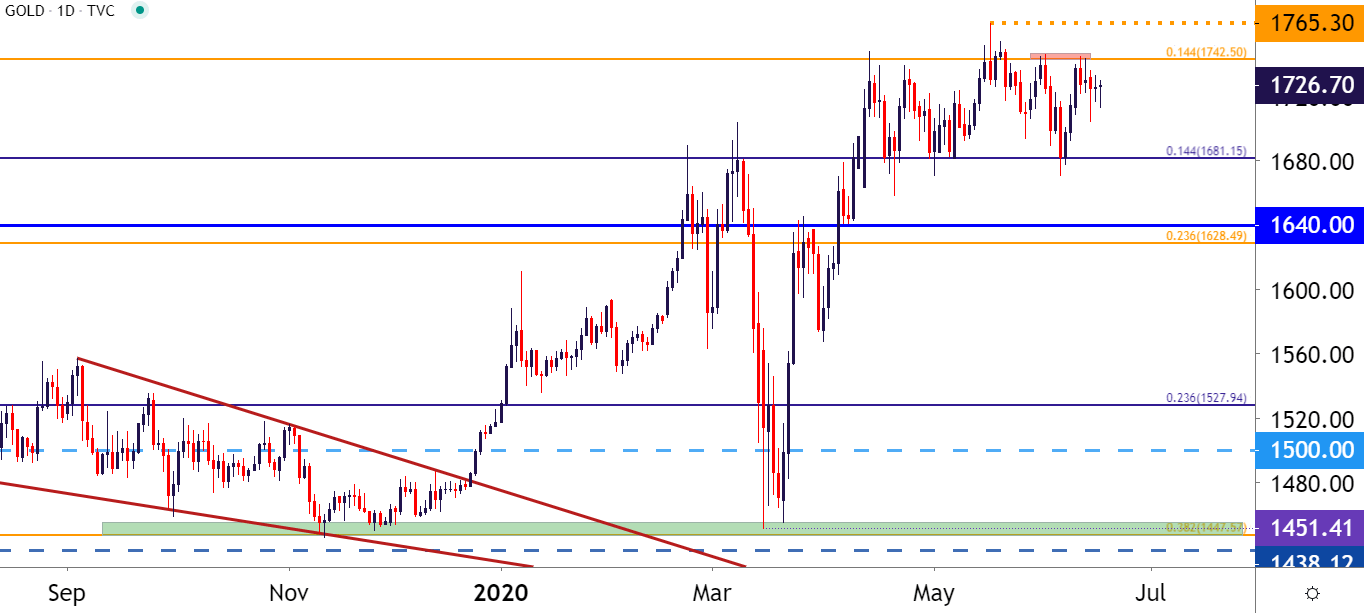
Chart prepared by James Stanley; Gold on Tradingview
Price action in Gold has been particularly slow over the past few trading days. There was a bit of momentum that showed in the aftermath of the FOMC rate decision. But, as looked at on Thursday, that merely pushed prices up to the same Fibonacci level that had functioned as resistance earlier in June, after which the topside push stalled and prices reverted back into a range-like backdrop.
Gold price levels appear to be of particular import given this now two months of range. The resistance side is showing around the 1742.50 Fibonacci level, which is the 14.4% marker of the post-Financial Collapse move in Gold. There was one instance of prices testing above this key point on the chart over the past two months, and that was when Gold traders got excited by the comment from FOMC Chair, Jerome Powell, when he said that there was ‘no limit’ to what the Fed could do with the liquidity programs available to them. Gold prices quickly perched up to a fresh high but, soon fell back below this key point on the chart and continued to find resistance at this level afterwards.
The support side of that recent range is showing around another 14.4% Fibonacci retracement, but this one is derived from the longer-term major move spanning from the 2009 low up to the 2011 high.
Gold Eight-Hour Price Chart

Chart prepared by James Stanley; Gold on Tradingview
--- Written by James Stanley, Strategist for DailyFX.com
Contact and follow James on Twitter: @JStanleyFX


