


Gold Price Analysis
- Gold prices have gained as much as 3% from the lows last Wednesday.
- Gold prices are overbought on the monthly chart, to a degree not seen since 2011.
- Fibonacci resistance is also playing a role, helping to hold strength at bay around the $1742.50 level on the chart.
Gold Grinds at Fibonacci Resistance
Last week didn’t start very positively for Gold bulls but it certainly did finish in a more upbeat manner. Gold prices have rallied by as much as 3% from the Wednesday low up to this morning’s high, and price action is tip-toeing up to that $1750 psychological level that’s proven so difficult to break. Assisting with resistance and just inside of that psychological level is a Fibonacci level of relevance, as the 14.4% retracement rests at $1742.50, which is helping to set today’s high.
On the monthly chart of Gold, however, are some of the most overbought conditions in the yellow metal since the market topped in 2011. The RSI reading on the monthly Gold chart is currently above the 75.00 level – something that’s only happened three previous times over the past twenty years. The previous example was around the 2011 top, and the one before that – just before the financial crisis when Gold prices shed approximately 34% over the course of six months. The only other example of RSI north of 75 was in 2006; and no major sell-off followed as Gold prices ranged for a few months before continuing the bullish trend (until eventually topping in 2008 with that second RSI read above 75).
Gold Monthly Price Chart
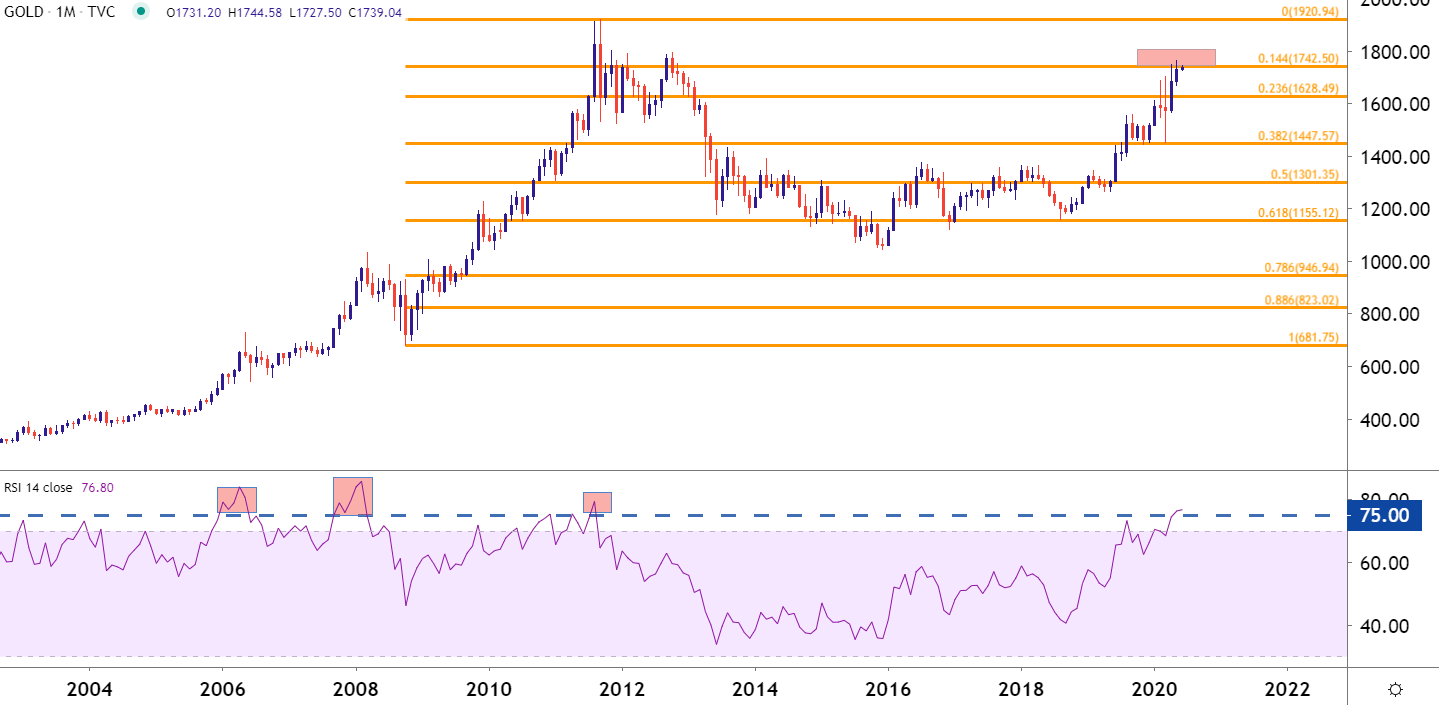
Chart prepared by James Stanley; Gold on Tradingview
Going down to the weekly chart helps to show just how contentious that area around 1742.50 has been: This price started to come back into play in mid-April, and prices put in another test in mid-May; both of which saw buyers fail to break through. But, perhaps more troubling is the fact that this resistance has held even as buyers have remained vigorously defending support, creating a rising wedge formation, which will often be approached with the aim of bearish reversals (to learn more about wedges, check out our candlestick section in the DailyFX Education section).

Also of interest and incorporating RSI into the mix again, RSI on the weekly has diverged even as Gold prices have recently set fresh seven-year-highs, further alluding to the possibility of pullback after what’s been a really strong past couple of months.
Gold Price Weekly Chart

Chart prepared by James Stanley; Gold on Tradingview
Going down to the daily chart and matters don’t appear as threatening and, possibly, can be framed in a bullish light. That horizontal resistance around 1742.50 has now been tested on three separate occasions; with the prior instance in late-May showing bulls taking on more ground, breaking up to another fresh seven-year-high. And after prices pulled back, a higher-low was formed, alluding to the potential for topside breakouts on the daily chart as that horizontal area of resistance is now coupled with a series of higher-lows.
Gold Daily Price Chart
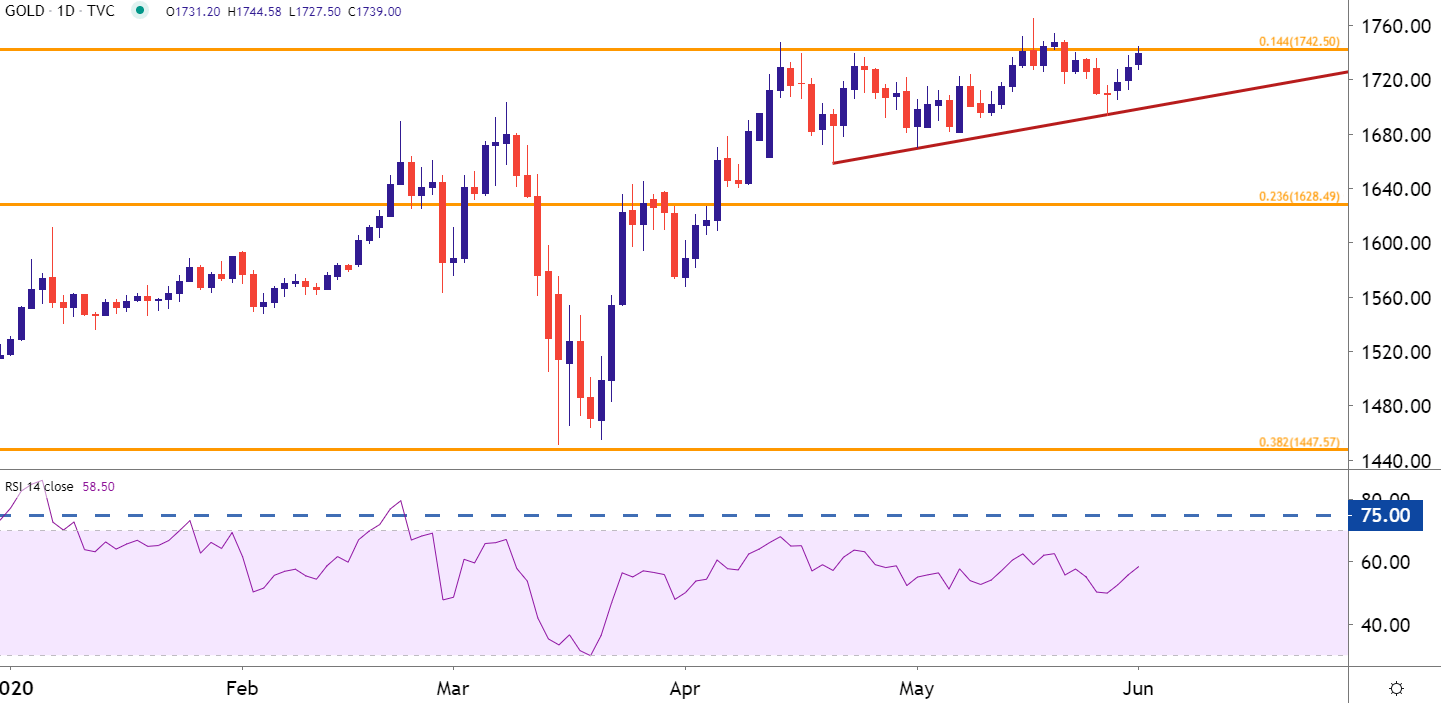
Chart prepared by James Stanley; Gold on Tradingview
In the above three charts, I’ve shown you two markedly different pictures: The longer-term picture which highlights the potential for a pullback or sell-off as overbought conditions run into long-term resistance. And on the short-term view which, here, is done with a daily chart – looking a potentially bullish scenario. This highlights the potential for near-term strength to continue facing pressure as overbought long-term conditions act as a hindrance at new highs. So gold prices may break out, but a continued bullish trend after that breakout may be a difficult prospect to project at this point given the look on longer-term charts.
--- Written by James Stanley, Strategist for DailyFX.com
Contact and follow James on Twitter: @JStanleyFX


