


US Dollar, British Pound, GBP/USD Price Analysis
- The FOMC rate decision from yesterday led into the BoE rate decision this morning.
- The US Dollar put in a bearish move post-FOMC.
- The BoE rate decision added more fuel to the bearish USD-theme, with GBP/USD breaking out to fresh near-term highs.
Fed, Bank of England Bring Some FX Volatility to the Table
It’s been a busy past 18 hours in global markets, as yesterday’s FOMC rate decision led into this morning’s rate meeting at the Bank of England. This was Mr. Mark Carney’s final rate decision atop the BoE, with successor Andrew Bailey set to take over from here. Neither bank made any actual moves but the BoE did cut growth forecasts for the next few years; somewhat of a parting gift from Mark Carney. Nonetheless, the British Pound has thus far gained on the back of this morning’s drivers as there were actual expectations that the bank may have cut this morning, and the fact that they didn’t quickly took rate cut bets out of the market as GBP/USD broke-out to a fresh near-term high.
Perhaps the most notable takeaway at this point has been the pullback in the US Dollar. The Greenback came into this series of drivers with a full head of steam, continuing a January rally that had wiped-out more than 50% of the Q4 sell-off in the currency. That 50% marker at 98.01 in DXY proved to be an item of near-term support that helped to hold the lows in DXY after the FOMC rate decision. That level has now been traded through, aided in-part by the bullish breakout in GBP/USD on the back of this morning’s Bank of England rate decision.
US Dollar Hourly Price Chart
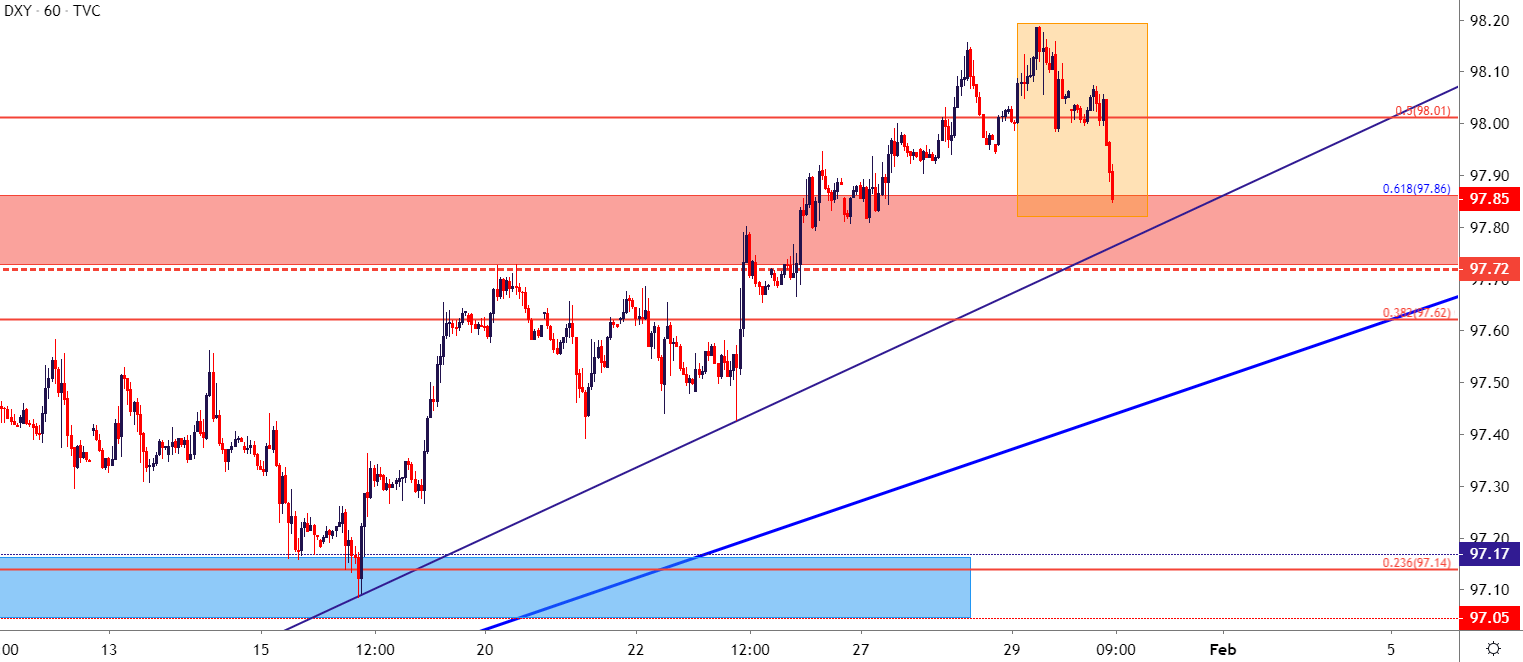
Chart prepared by James Stanley; US Dollar on Tradingview
In GBP/USD, the pair had previously put in a dour week of price action with buyers remaining on the sidelines as the pair dwindled back to the psychological 1.3000 level. Yesterday even brought some temporary breaches of that barrier but price action soon returned above the level and held until this morning’s European open.
The BoE rate decision acted as a slingshot as rate cut bets were quickly priced-out of the market; and even with the drag produced by those forecast reductions, the pair has continued to jump in the aftermath, raising the possibility of longer-term trend possibilities in the currency and, specifically, in the GBP/USD pair. This is something I’ve been tracking in webinars for some time now as a longer-term bull pennant formation has appeared in GBP/USD.
At this point, GBP/USD is testing a near-term resistance zone running the 1.3117 Fibonacci level. Beyond that, 1.3187 looms large and then 1.3250 becomes a potential point of resistance.
GBP/USD Hourly Price Chart
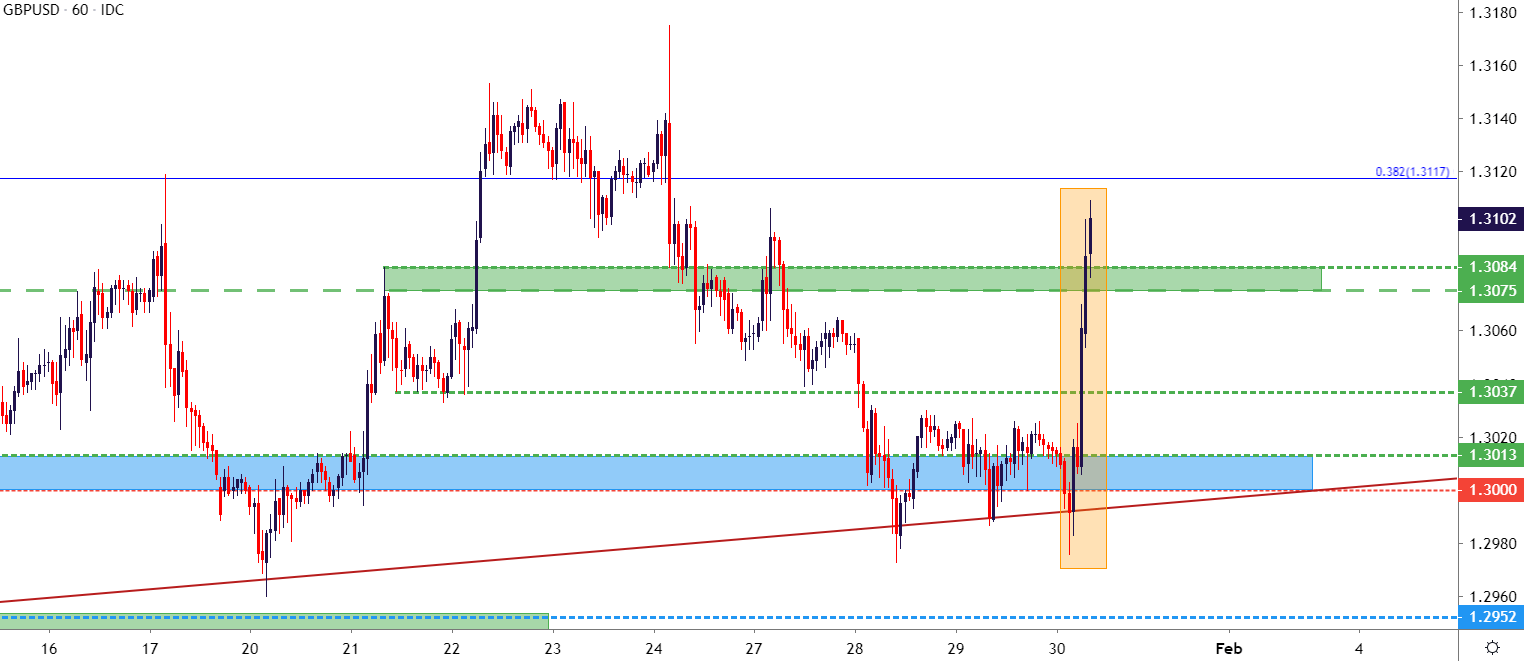
Chart prepared by James Stanley; GBPUSD on Tradingview
Bigger picture, the operative question is whether buyers are ready to return to the British Pound. Tomorrow is the official Brexit day and this has generally been a bullish driver in the currency as optimism has taken over in the past few months. The first three quarters of last year were fairly brutal for the GBP as Brexit was opaque and few harbored any positive prognostications as to how the whole split might finally go down. But last September is when a long-term trendline came into play, and after some jostling in the month of September, buyers have taken over in the past few months, posing a series of bullish breakouts in the pair.
| Change in | Longs | Shorts | OI |
| Daily | 3% | -7% | -3% |
| Weekly | 4% | -10% | -5% |
GBP/USD Monthly Price Chart
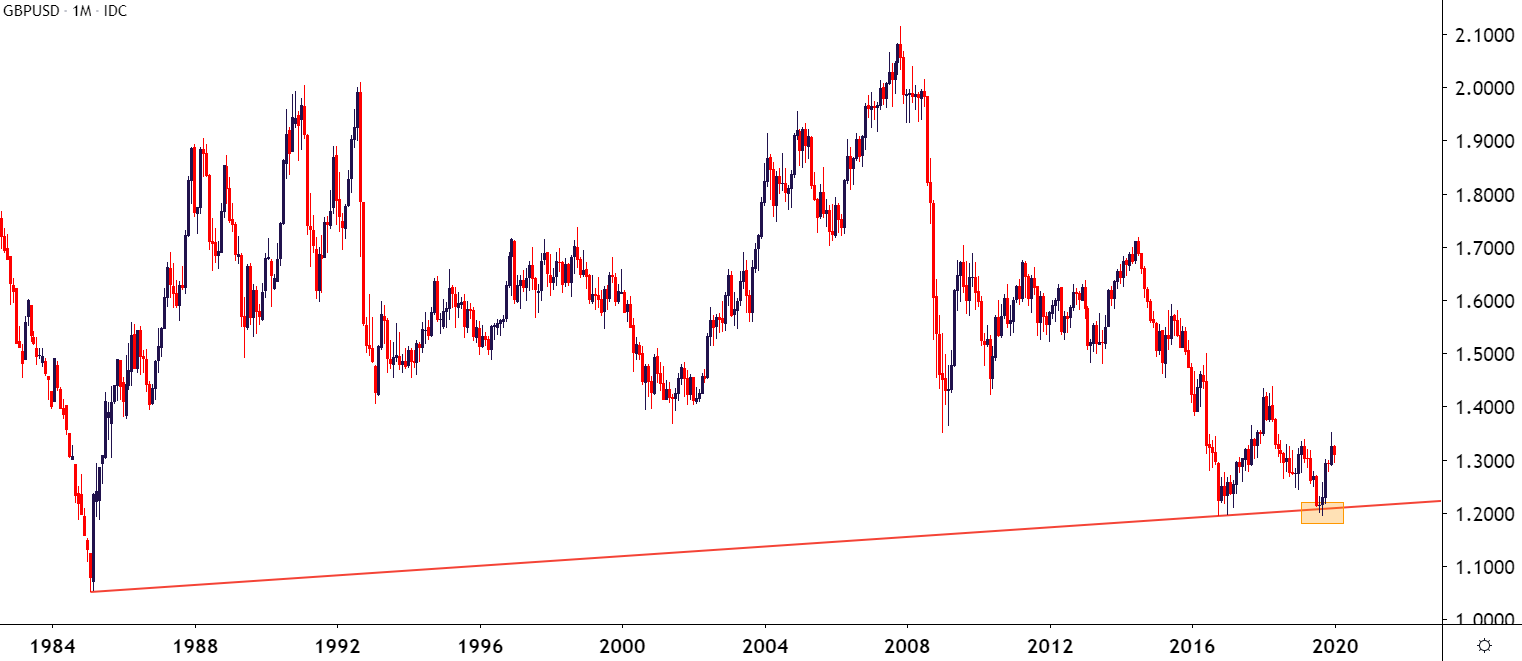
Chart prepared by James Stanley; GBPUSD on Tradingview
October produced a big breakout in the pair as GBP/USD jumped by more than 800 pips in the month; resistance eventually playing-in off of the 1.3000 psychological level. The pair then spent the next six weeks digesting that gain, trading in a range with a bullish bias. And then December brought even more hope on the Brexit-front and prices again broke-out to fresh highs, this time finding resistance off of the 1.3500 handle.
Since that 1.3500 test in mid-December, a similar train of digestion has shown in GBP/USD as what came up after the 1.3000 test in October; but this time price action has built in to a symmetrical wedge formation which, when taken with the prior bullish trend, makes for a bull pennant formation.
The support side of that wedge/pennant was tested multiple times this week, through FOMC and BoE, but so far that level has held and buyers have come back into the matter, keeping the door open for longer-term bullish scenarios in GBP/USD, particularly with Brexit day so nearby.
GBP/USD Daily Price Chart

Chart prepared by James Stanley; GBPUSD on Tradingview
--- Written by James Stanley, Strategist for DailyFX.com
Contact and follow James on Twitter: @JStanleyFX


