


Crude Oil Talking Points:
- The early-year spike in Crude Oil prices has been completely priced-out at this point, with WTI prices almost 5% below last year’s close.
- While WTI spiked above the $65 level just last week, calming tensions around the US-Iran scenario have allowed for an aggressive pullback to show. Those declines have started to slow this week as a trendline has come-in to the matter to help offer support.

Crude Oil Price Spike Quickly Dissipates
There was immense pressure on the bid in crude oil prices as the page turned into 2020. While WTI spent much of last December grinding higher to finally climb above the 60-level, it was increasing tensions between the US and Iran shortly after the New Year’s open that catapulted crude prices up to a fresh eight-month-high. But, as looked at shortly after that high printed, chasing the move appeared dangerous and short-side fades began to look more attractive as price action had started to settle.
That downside move has continued until price action in WTI found support at a bullish trendline projection. That trendline started to come into play on Monday and has since helped to hold the lows following a precipitous decline over the prior week.
WTI Crude Oil Four-Hour Price Chart
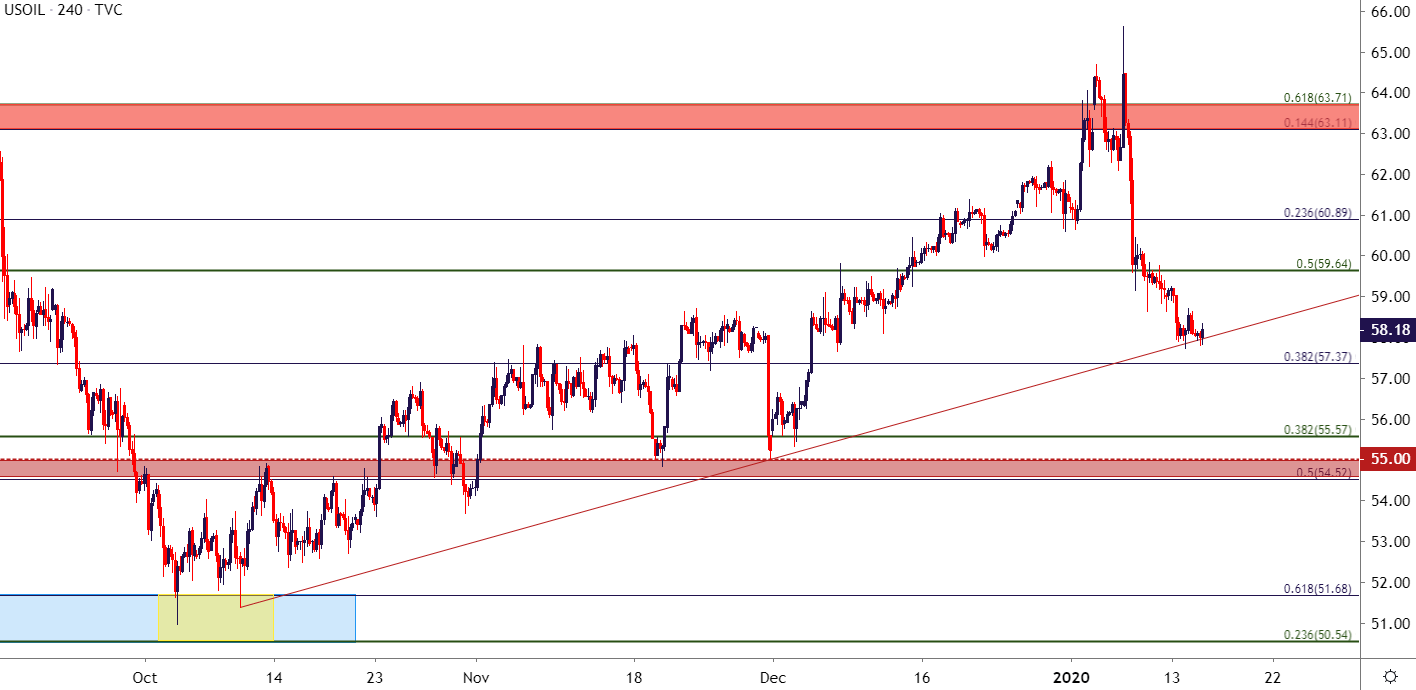
Chart prepared by James Stanley; Crude Oil on Tradingview
On a shorter-term basis, the intersection with that trendline has brought back-and-forth price action over the past couple of days, offering a bit of reference for near-term strategy. This recent outlay doesn’t quite have the consistency of a range but, nonetheless, offers some usable levels that traders can incorporate into strategy parameters. The level at 58.65 becomes of interest, as this was a prior swing-low that’s turned into near-term resistance. Traders looking to get short in WTI could look for a re-test at this level, combined with a show of sellers to re-open that door. Alternatively, should prices test above this price, amounting to a fresh two-day-high, there could be potential for short-term bullish strategies as well, looking for price action to push towards the 60-level. There’s a Fibonacci level at 59.64 that could come into play for a more nearby profit target before the 60 big figure might reenter the equation.
| Change in | Longs | Shorts | OI |
| Daily | 3% | -7% | 1% |
| Weekly | 31% | -38% | 7% |
WTI Crude Oil Hourly Price Chart

Chart prepared by James Stanley; Crude Oil on Tradingview
--- Written by James Stanley, Strategist for DailyFX.com
Contact and follow James on Twitter: @JStanleyFX


