


Crude Oil Price Outlook Talking Points:
- Crude oil prices have been on offer this week, breaking below a bear flag formation and running down towards July lows just above the 56-handle.
- With Tropical Storm Barry being downgraded and supply disruptions in the Gulf of Mexico appearing to be not as bad as feared, combined with the current technical backdrop, there could be scope for further losses in WTI crude oil prices.
- DailyFX Forecasts are published on a variety of markets such as Gold, the US Dollar or the Euro and are available from the DailyFX Trading Guides page. If you’re looking to improve your trading approach, check out Traits of Successful Traders. And if you’re looking for an introductory primer to the Forex market, check out our New to FX Guide.
Oil Prices Break Below Bear Flag and Continue to Go
Oil prices have been on offer this week as last week’s bid around supply disruptions in the Gulf has been faded-out of the market. Coming into this week, there was the potential for topside run, largely on the basis of last week’s production draw on the back of the brewing Tropical Storm Barry. But, that storm was downgraded over the weekend and the supply disruptions appear to be less-than-feared. This has allowed for sellers to re-take control of Oil prices, bringing back the recent theme of weakness that’s been fairly-clear since June trade and re-opening the door for a trip back to the 55-level in WTI crude oil prices.
As discussed last Friday, the zone of prices from 59.64-60.00 was a key area on the chart, and a push back below that level would re-open the door for short-side strategies. That happened shortly after this week’s open, and prices soon pushed-lower and then created a bear flag formation. After a re-visit to the 60-level for resistance, that bear flag unwound with aggression over the past few trading days, running through both targets on the way to fresh three-week-lows.
WTI Crude Oil Hourly Price Chart
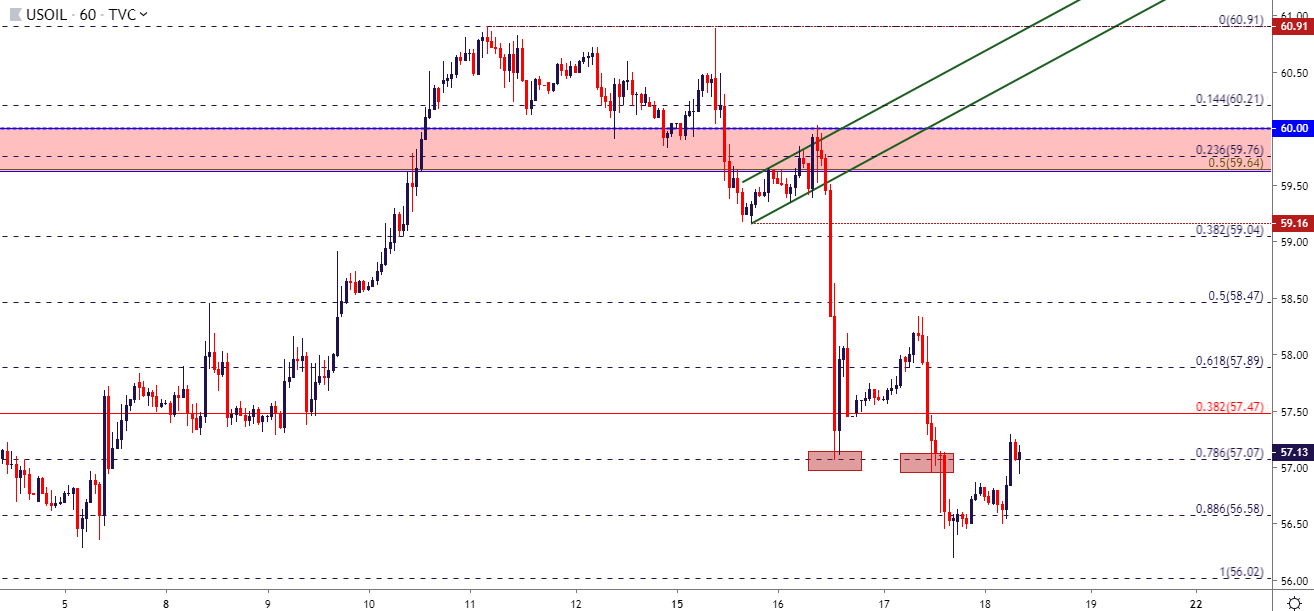
Chart prepared by James Stanley
Taking a step back on the chart and another set of levels becomes of interest. From the Daily chart, the topping-out scenario that played into this week’s open becomes a bit more explainable, as the Thursday and Friday dojis from last week came-in right around the 23.6% retracement of the December-April bullish run; and short-term resistance is showing around the 38.2% marker of that same study. Support at this point appears to be coming-in from prior July lows, taking from around the 56.03-56.25 zone.
WTI Crude Oil Daily Price Chart
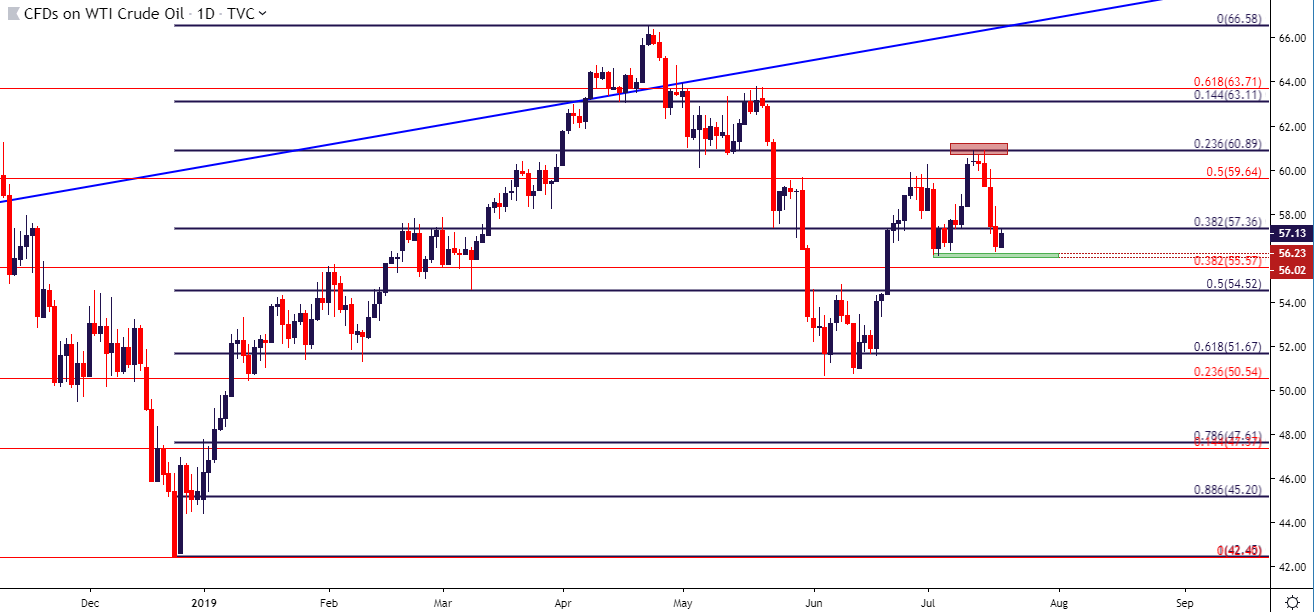
Chart prepared by James Stanley
At this point, the short-side of Oil prices appears to remain the most attractive scenario from a technical perspective. Even last week’s fear-driven bid was only able to bring a revisit to resistance; and as that fear has gotten priced-out, the prior prevailing trend of weakness has taken back-over.
Given the pace of this week’s decline, bearish entry could be of challenge and would likely require some element of aggression. The Fibonacci level at 57.36 could be of interest for lower-high resistance, as this price had provided some support last week as prices were moving higher. Beyond that, yesterday’s swing-high at 58.34 could be of interest for lower-high resistance. The former of those levels could be difficult to work with if using the 56.23-56.02 support zone for near-term targets, as stops above 58.34 wouldn’t quite offer a one-to-one risk-reward ratio at this point.
As an alternative approach, breakout strategies could remain of interest, looking for a breach of 56 down to support potential around 55.57. At that point, break-even stops could be investigated with deeper target potential set to levels around 55.00 and 54.52.
WTI Crude Oil Four-Hour Price Chart
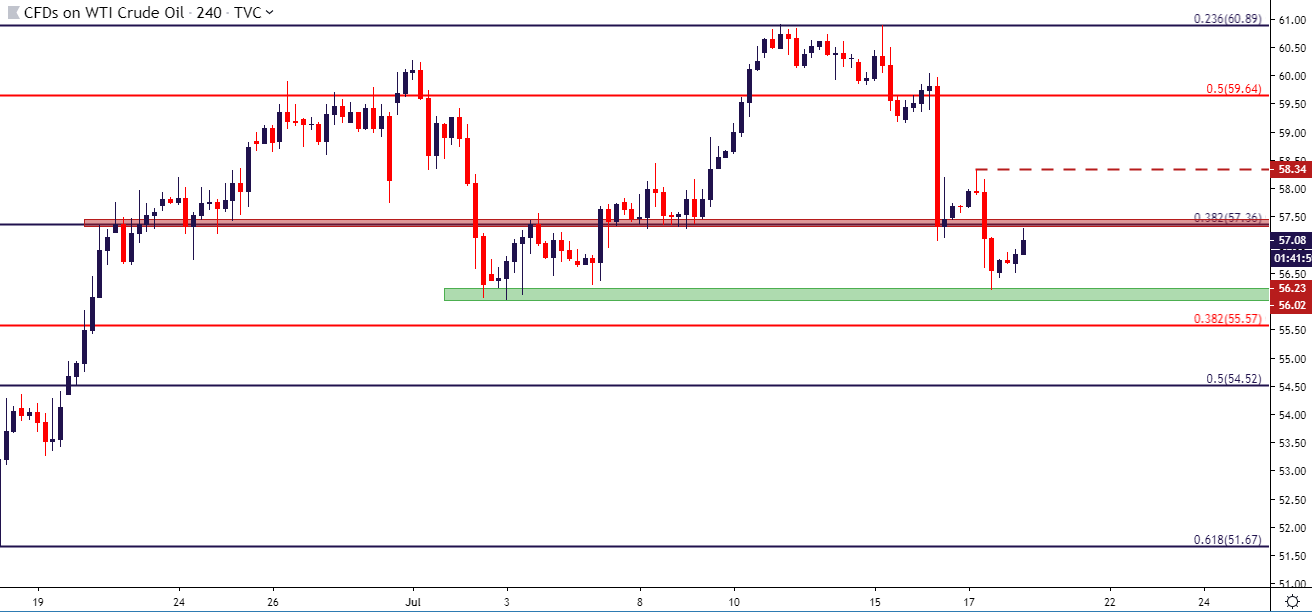
Chart prepared by James Stanley
To read more:
Are you looking for longer-term analysis on the U.S. Dollar? Our DailyFX Forecasts have a section for each major currency, and we also offer a plethora of resources on Gold or USD-pairs such as EUR/USD, GBP/USD, USD/JPY, AUD/USD. Traders can also stay up with near-term positioning via our IG Client Sentiment Indicator.
Forex Trading Resources
DailyFX offers an abundance of tools, indicators and resources to help traders. For those looking for trading ideas, our IG Client Sentiment shows the positioning of retail traders with actual live trades and positions. Our trading guides bring our DailyFX Quarterly Forecasts and our Top Trading Opportunities; and our real-time news feed has intra-day interactions from the DailyFX team. And if you’re looking for real-time analysis, our DailyFX Webinars offer numerous sessions each week in which you can see how and why we’re looking at what we’re looking at.
If you’re looking for educational information, our New to FX guide is there to help new(er) traders while our Traits of Successful Traders research is built to help sharpen the skill set by focusing on risk and trade management.
--- Written by James Stanley, Strategist for DailyFX.com
Contact and follow James on Twitter: @JStanleyFX


