


Talking Points:
- Global equities remain on the move and the Nikkei has broken out from a big level of resistance over the past few trading days, adding a bit of resolution to an ascending triangle formation that’s been building over the past few months. Later tonight/early-Wednesday brings a Bank of Japan rate decision with very few expectations for anything new. Will the BoJ provide any hints or clues towards future changes towards their QE policy that just so happens to buy ETF’s of the very same indices that have been breaking out ahead of the meeting?
- In FX-land, the week started with haste but has since calmed, as both EUR/USD and the US Dollar are holding at key areas on the chart. In EUR/USD, prices have returned to the big resistance zone that we’ve been following that runs from 1.1709-1.1750. Bulls don’t look to soon let up, so at this stage a resistance break is starting to feel more likely. In the US Dollar, on the other hand, prices have built into a descending triangle formation as the Dollar continues to sit on support.
- DailyFX Forecasts on a variety of currencies such as the US Dollar or the Euro are available from the DailyFX Trading Guides page. If you’re looking to improve your trading approach, check out Traits of Successful Traders. And if you’re looking for an introductory primer to the Forex market, check out our New to FX Guide.
Do you want to see how retail traders are currently trading the US Dollar? Check out our IG Client Sentiment Indicator.
EUR/USD Back to Confluent Resistance: Will Bulls Finally Break Free?
At this point the primary hope is that EUR/USD is earning frequent flyer miles for all of these trips back to resistance, as we’re now seeing the third such visit to this zone over the past three weeks. We’ve been following the resistance area in EUR/USD that runs from 1.1709-1.1750; looking for a topside break to re-open the door to longer-term themes of continuation.
This area had helped to hold the highs in the latter-portion of July, but it also contains multiple Fibonacci levels in the same range. This is a confluent area as there are multiple reasons for sellers to come-in and respond, and that’s largely what we’ve been seeing over the past few weeks. But following each response, we’ve seen an increasingly strong response from bulls as buyers have started to come-in at higher-lows. On the chart below, we’ve added a blue bullish trend-line underneath the higher-lows that have printed over the past week, following last week’s support test at the 1.1530 level.
EUR/USD Four-Hour Price Chart: Increasing Strength on Bullish Response
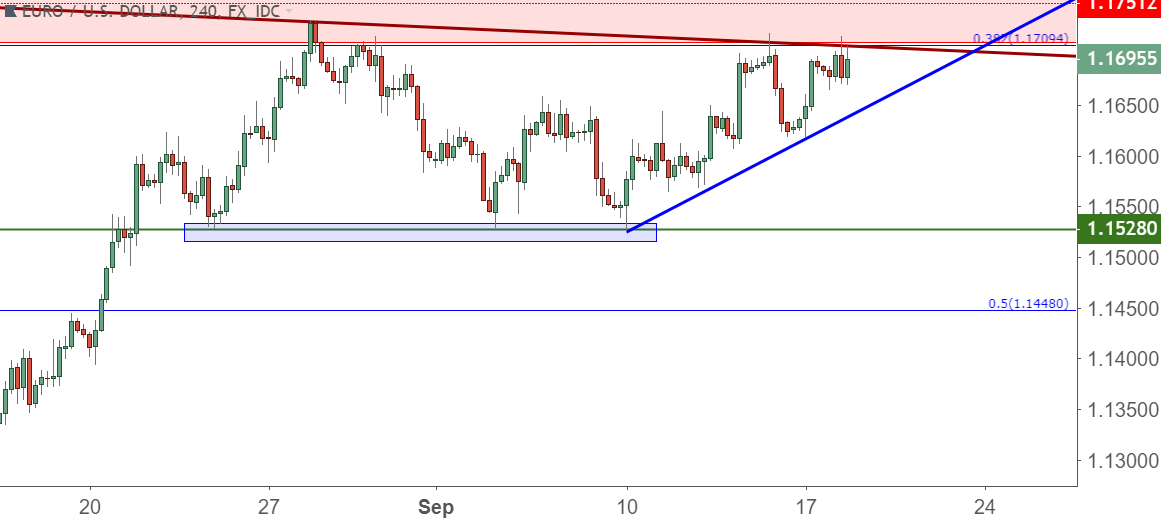
Chart prepared by James Stanley
Taking a step back, this highlights a critical theme for EUR/USD and, in-turn, the US Dollar. EUR/USD remained strong as we traded into Q2 of this year, at which point a brutal reversal began to show as a culmination of factors pushed the single currency lower. Eventually, prices found support around the 1.1530 level in late-May, and this held for the early portion of the summer through multiple down-side tests.
But early-August brought more risk aversion into the equation as worries started to grow around European banks’ exposure to Turkey. This finally allowed that 1.1530 support to give way, and that down-side run lasted for about a week. But after support came-in off of the 1.1300 handle, tonality very much changed, and just two weeks later prices had returned back to this key resistance zone that runs from 1.1709-1.1750. That resistance has capped the advance in the three weeks since, but bulls are showing no signs of letting up.
EUR/USD Eight-Hour Price Chart
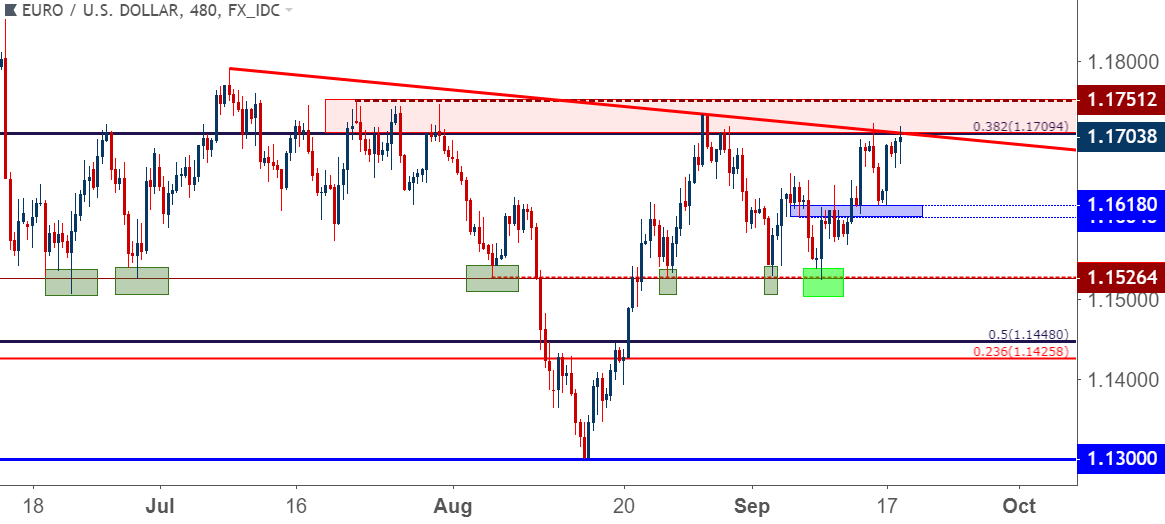
Chart prepared by James Stanley
On a longer-term basis, we can see why the current area of resistance is so important to near-term EUR/USD price action. A break above this confluent zone would not only give us fresh two-month highs, but the door would appear opened for a move of bullish continuation towards the 23.6% retracement of last year’s major move, just above the 1.2000 psychological level; and this would likely carry impact into the US Dollar, as we look at below.
EUR/USD Daily Price Chart: At a Key Juncture of Chart Resistance
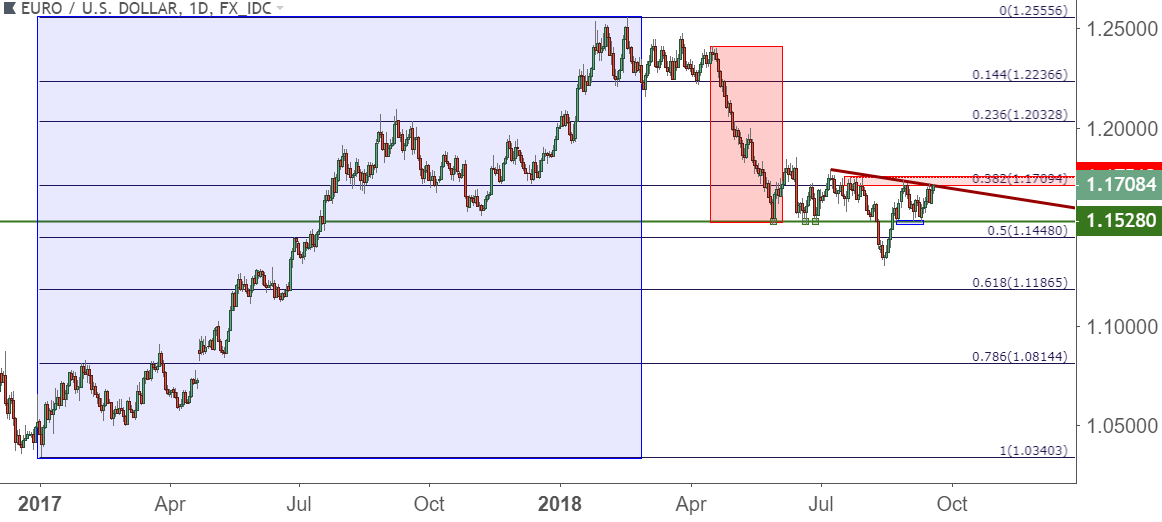
Chart prepared by James Stanley
US Dollar Dithers at the Lows
While the week opened with some excitement in the US Dollar, the past 22 hours have been rather uneventful.
The US Dollar put in a respectable bounce as we moved towards last week’s close, eventually finding resistance on the underside of the 95.00 level, which had previously helped to offer support. But as we opened this week, the same selling pressure that was commonplace over the past few weeks took over and drove the US Dollar down to fresh monthly lows. But – from yesterday’s US equity open, we’ve largely just been sitting on that support, waiting for the next push in either direction to get a clue for which trend may take over in USD as we wind down Q3.
US Dollar Hourly Price Chart: A Tough Month for Dollar Bulls
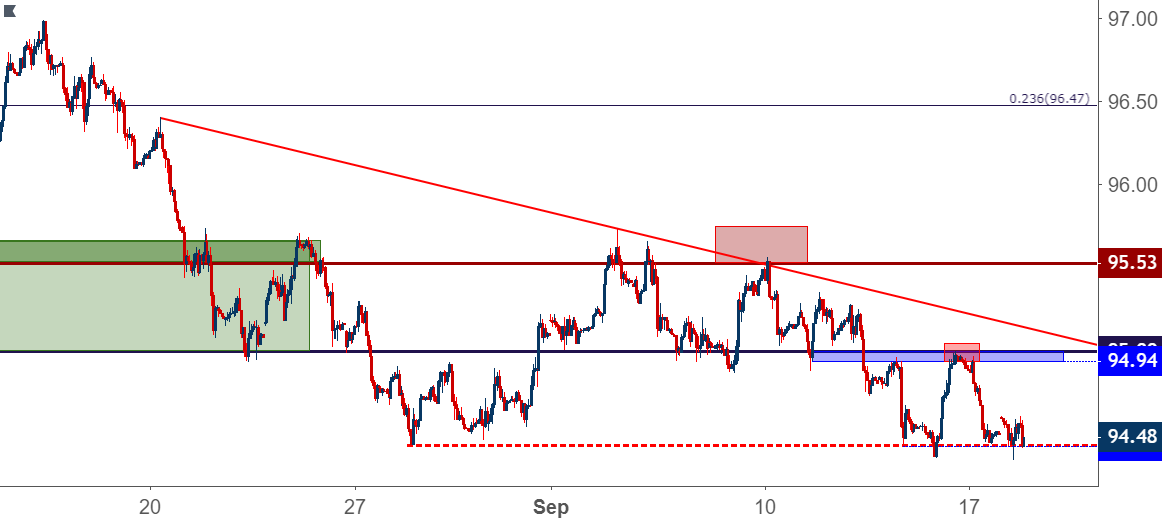
Chart prepared by James Stanley
On a longer-term basis, the case for bearish strategies in USD continues to build. We can see where the past month of price action has been building into a descending triangle pattern. This will often be approached in a bearish manner, looking for the drive that’s helped to produce lower-high resistance to carry-through to a break of horizontal support. This would be supported by the failure from bulls to hold prior support, combined with the recent observation of August support becoming September resistance at that 95.00 level.
US Dollar Eight-Hour Price Chart: A Building Case for Dollar Bears
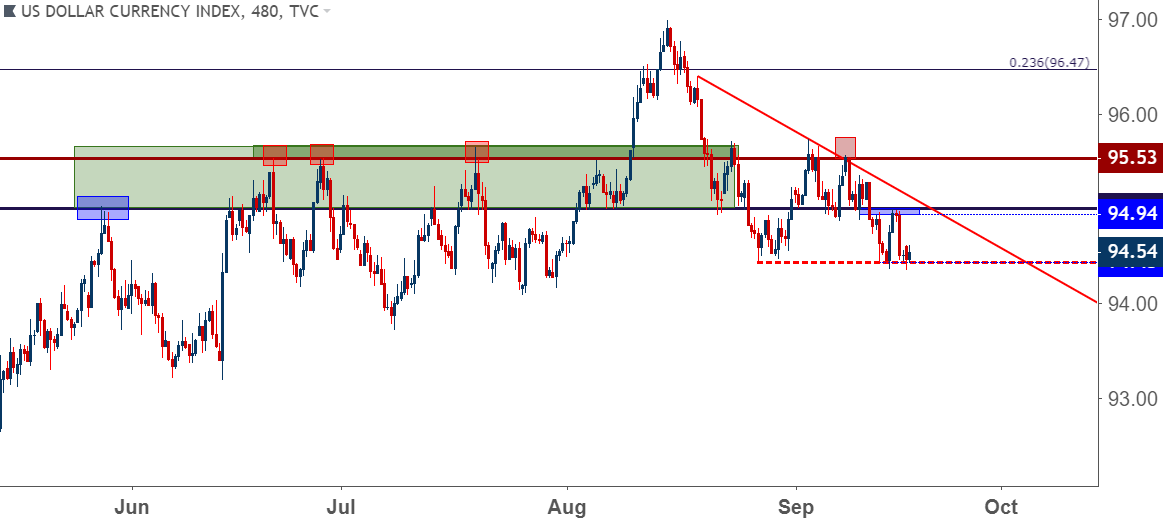
Chart prepared by James Stanley
Nikkei Breaks Out from a Long-Term Resistance Level
Later tonight brings the Bank of Japan’s September rate decision, and over the past few trading days an aggressive bullish breakout has taken hold in the Nikkei. We looked into the setup ahead of the breakout in our earlier-month Equity forecast, pointing to the ascending triangle formation that had been building for some time. Such a formation will often be approached in a bullish manner, expecting the motivation that’s brought bulls into support at higher-lows to eventually carry-through to a topside break of horizontal resistance. That horizontal resistance was coming from a key level on the Nikkei chart, as this was taking place at the 50% marker of the 28-year move, taking the high from 1990 down to the 2008 Financial Collapse low.
Nikkei Monthly Price Chart: Testing Through a Key Long-Term Level
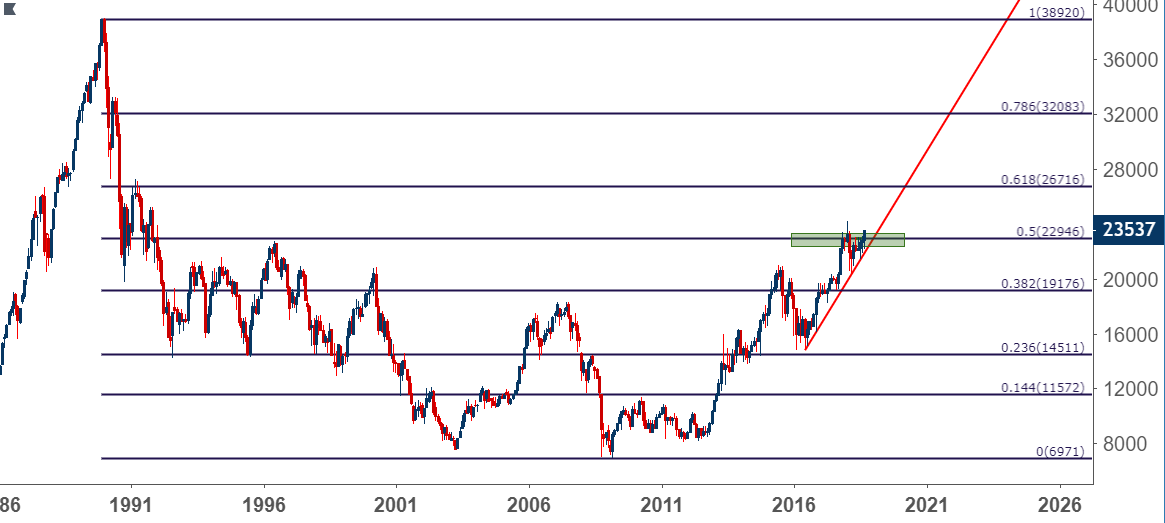
Chart prepared by James Stanley
Last Friday saw the first move above this key level since we had fallen-below in February. That breakout has extended so far on the new week as the Nikkei is now trading at fresh seven-month highs.
Later tonight’s Bank of Japan rate decision will likely be heavily watched for clues towards additional topside potential. As recently as August we had fears that the bank might be nearing a scale-down of their massive stimulus program, which could negatively impact equity prices given the outsized support from the Japanese Central Bank over the past six years. But – inflation remains lackluster and just last night we heard comments from Japanese Finance Minister, Taro Aso, that the BoJ will set appropriate policy to attain the bank’s 2% inflation target. He also said that the debate over ending stimulus is premature and could cause confusion in markets; heavily implying that taper or stimulus exit fears are yet unfounded.
So, while tonight’s BoJ rate decision will likely be devoid of any earth-shattering announcements, focus will be on the details as to how aggressive or passive the BoJ may be with asset purchases moving forward. In the Nikkei – attention will be on whether the index can move-up towards a challenge the 26-year high that was set in January, or whether we get a pullback to the prior breakout resistance level that may offer the potential for higher-low support.
This could carry overtones into FX, as Yen-weakness has started to grow more prominent to go along with this topside break in the Nikkei. We discussed this in last Thursday’s webinar, and we lined up two setups around the Yen in this week’s FX Setups of the Week.
Nikkei Daily Price Chart: Fresh Seven-Month Highs
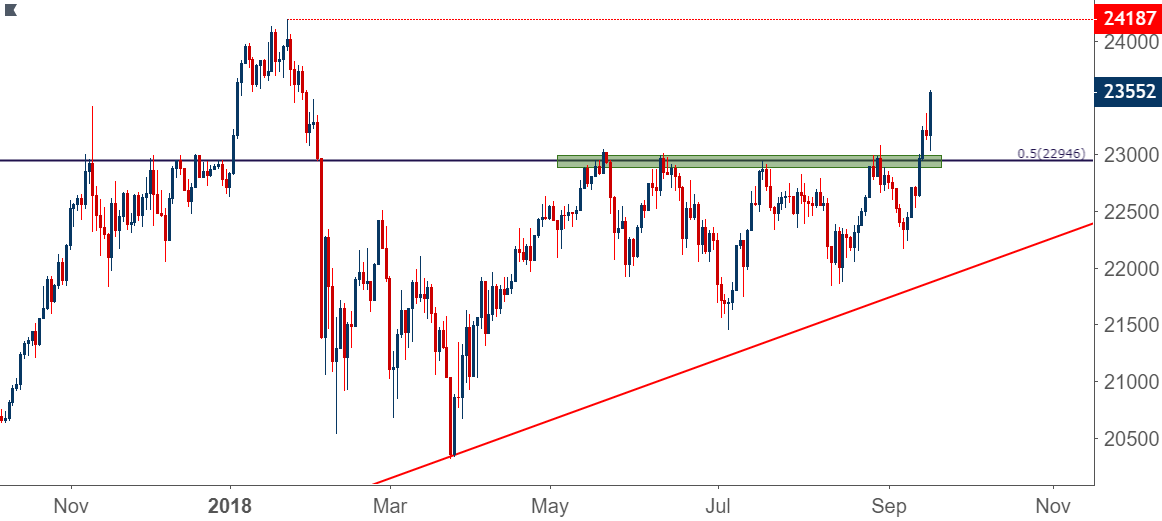
Chart prepared by James Stanley
To read more:
Are you looking for longer-term analysis on the U.S. Dollar? Our DailyFX Forecasts for Q3 have a section for each major currency, and we also offer a plethora of resources on USD-pairs such as EUR/USD, GBP/USD, USD/JPY, AUD/USD. Traders can also stay up with near-term positioning via our IG Client Sentiment Indicator.
Forex Trading Resources
DailyFX offers a plethora of tools, indicators and resources to help traders. For those looking for trading ideas, our IG Client Sentiment shows the positioning of retail traders with actual live trades and positions. Our trading guides bring our DailyFX Quarterly Forecasts and our Top Trading Opportunities; and our real-time news feed has intra-day interactions from the DailyFX team. And if you’re looking for real-time analysis, our DailyFX Webinars offer numerous sessions each week in which you can see how and why we’re looking at what we’re looking at.
If you’re looking for educational information, our New to FX guide is there to help new(er) traders while our Traits of Successful Traders research is built to help sharpen the skill set by focusing on risk and trade management.
--- Written by James Stanley, Strategist for DailyFX.com
Contact and follow James on Twitter: @JStanleyFX


