


Talking Points:
- Tomorrow’s economic calendar is light, but Thursday is big as we have both Bank of England and European Central Bank rate decisions. Little is expected from the BoE but the ECB is widely-expected to begin whittling down bond purchases in the initial stages of stimulus-taper. The ECB press conference begins at 8:30 AM ET, and this is the same time that US CPI for the month of August is released, making for a potentially volatile backdrop in EUR/USD as key drivers from both represented economies will be in the spotlight at the same time.
- Both EUR/USD and US Dollar price action have been showing digestion so far in September after an abnormally active summer. Bullish and bearish scenarios exist around the US Dollar at the moment, as the 2017 down-trend was brought to question by the two-month spurt of strength in USD in April and May; while the bullish move that showed there has brought little by way of gains in the four months since. The direction that EUR/USD ultimately breaks will likely have a large bearing on which of these scenarios plays out in the US Dollar. The big question at this point appears to be – what could Mario Draghi say to elicit Euro weakness while formally announcing stimulus-taper at Thursday’s ECB rate decision.
- DailyFX Forecasts on a variety of currencies such as the US Dollar or the Euro are available from the DailyFX Trading Guides page. If you’re looking to improve your trading approach, check out Traits of Successful Traders. And if you’re looking for an introductory primer to the Forex market, check out our New to FX Guide.
Do you want to see how retail traders are currently trading the US Dollar? Check out our IG Client Sentiment Indicator.
EUR/USD Back-Below 1.1600 as Prices Build into Descending Triangle
It’s been a pensive past couple of weeks for EUR/USD. After opening August by selling-off down to fresh lows, driven by fears around European banks’ exposure to Turkey, EUR/USD caught support mid-month and then spent the next two weeks erasing a large portion of those losses. Resistance eventually showed around the same 1.1709-1.1750 area that had held the highs in July, and since then we’ve had a bit of back-and-forth price action.
With support showing around 1.1525-1.1530 combined with the lower-highs that have continued to print, we now have a short-term descending triangle formation. This type of formation will often be approached in a bearish manner, expecting the increasing motivation from sellers coming in at lower-highs to eventually break below the horizontal support that’s developed.
EUR/USD Two-Hour Price Chart: Lower-Highs with Horizontal Lows Creates Descending Triangle
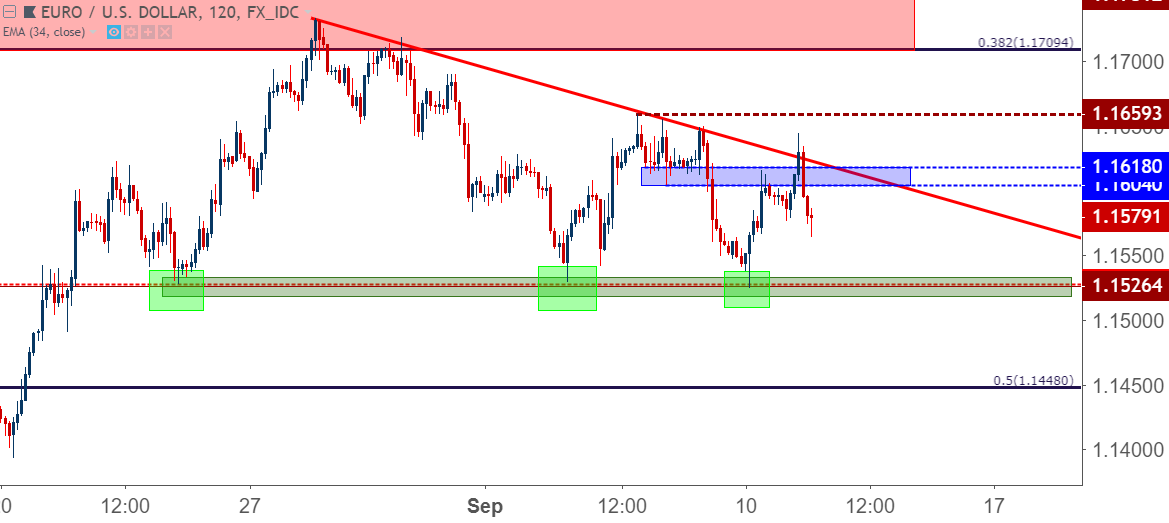
Chart prepared by James Stanley
On a bigger-picture basis, that support around 1.1530 has been at work for some time, including a large chunk of this summer. This is where support had finally showed-up after the brutal move in April and the month of May. This price held the lows through multiple downside tests, including the ECB’s June rate decision in which they announced stimulus taper while warning that rates would stay at current levels ‘at least through the summer of 2019.’
This level didn’t give way until early-August. This is when jitters around European banks’ exposure to Turkey was creating considerable risk aversion. But life below 1.1525 didn’t last long, as EUR/USD had recovered back-above this price just a week-and-a-half later, and has since put in three additional support tests while holding the lows in the pair.
EUR/USD Eight-Hour Price Chart: Welcome Back, 1.1530

Chart prepared by James Stanley
ECB on Deck – Will They Announce Stimulus Taper?
This Thursday brings a big ECB meeting as the bank is expected to begin whittling down bond purchases. This speaks to a theme that’s brought significant drama over the past year, as the prospect of stimulus exit and eventual higher rates helped to drive the single currency higher throughout last year and into the early portion of 2018.
This was so pronounced that the ECB appeared skittish to furnish any details around stimulus exit, or rate hikes, for fear of creating even more Euro-strength that could, eventually, erode inflation to the degree where the ECB needs to get dovish again.
It wasn’t until June, with the backdrop of Euro weakness having re-entered the equation around fears emanating from Italian politics, that the ECB made that announcement of stimulus taper. But – Mario Draghi also successfully split the themes of stimulus taper and rate hikes by saying that even after tapering stimulus, rates would stay at current levels ‘at least through the summer of 2019.’ So, even if the ECB does announce stimulus taper tomorrow, we are still fairly far away from any rate hikes. The big question is what else Mr. Draghi might be able to say to drive the single currency lower.
DailyFX Economic Calendar: A Big Thursday for the Euro and the European Central Bank

Chart prepared by James Stanley
US Dollar Bounces from 95.00 Support, Again, as Price Action Continues Narrowing
Another day, another support test in the US Dollar. Yesterday we looked at DXY selling-off after testing resistance from last week; and that resistance from last week came from the same 95.53 area that had helped to hold the highs through June and July. This move off of resistance helped to lift EUR/USD and GBP/USD, and prices in DXY ran all the way down to test below the 95.00 level. And, again, just like last week, buyers responded to push prices back-above.
The net of the past two weeks in the US Dollar has been a narrowing of price action as highs are coming in a bit lower than last week while lows are just a bit higher.
US Dollar Four-Hour Price Chart

Chart prepared by James Stanley
Taking a step back, there are realistic scenarios for both bullish and bearish outcomes in the US Dollar.
The Greenback was in a rigid down-trend from January of 2017 to February of this year. Support finally began to show around the 50% marker of the 2011-2017 major move, and after showing up in mid-February, the declines in USD stalled and DXY ranged for most of the next two months. In April, USD strength began to show as EUR/USD and GBP/USD went into sell-offs, and this finally allowed for the US Dollar to break the bearish trend that had become so entrenched during the previous 15 months.
US Dollar Weekly Price Chart: Year-Long Down-Trend Breaks Trend-Line in April
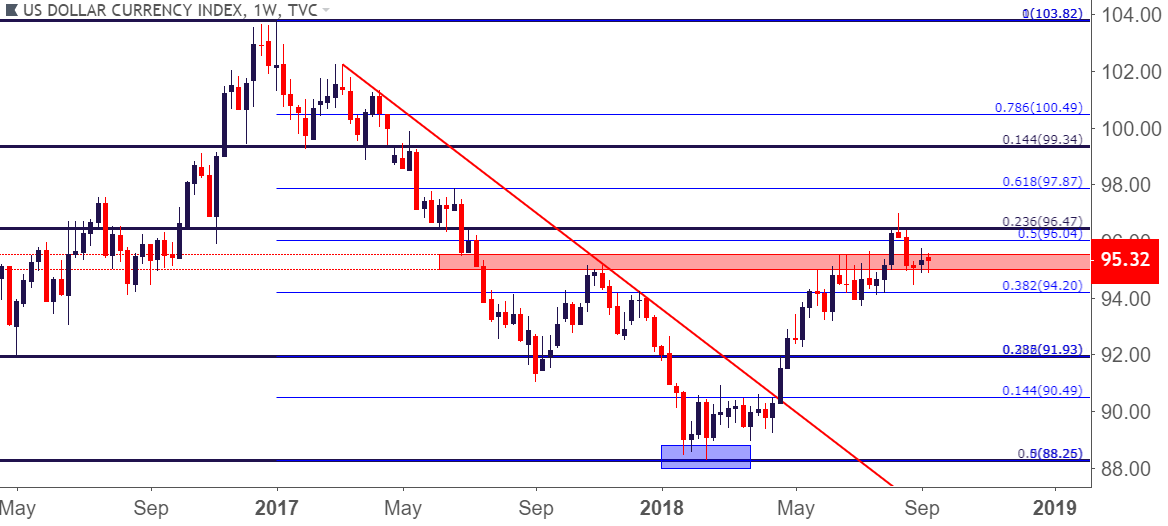
Chart prepared by James Stanley
But it was in April when both GBP and the Euro caught significant gusts of selling, driven by falling inflation and more dovish Central Banks; and then in the month of May a bit of risk aversion began to show as Italian politics raised numerous questions around how the ECB might handle a debt standoff with the newly installed government. This drove EUR/USD down towards the 1.1500 level, at which point support developed just a bit above the major psychological level. That support held for the next two months, including through the June ECB rate decision in which the bank announced their plans to taper stimulus.
In the US Dollar, this equated to that resistance test at 95.53. As EUR/USD spent much of June and July churning near support, the US Dollar spent that same time churning near resistance. And when another gust of risk aversion showed in early-August around European banks’ exposure to the developing situation in Turkey, EUR/USD finally dropped below 1.1500 and USD drove up to fresh highs, if only temporarily. The second-half of August saw markets step back from the ledges of risk aversion, and EUR/USD recovered while DXY fell back to that prior area of churn, where we’ve remained for much of the past two weeks.
US Dollar Daily Price Chart: Bullish April, May Lead to Grind Near Resistance

Chart prepared by James Stanley
The Bullish Scenario for USD:
Given the dynamics of the prior six months, it would appear that the bright spot for US Dollar strength is continued risk aversion, particularly risk aversion around the Euro-Zone. While rate policy remains tilted in the US Dollar’s favor, with the Fed continuing in their rising rate cycle with an expected rate hike later this month, this fact was the same throughout last year; and it didn’t stop USD from losing 15% then, why would this change matters now?
Also concerning rate policy – we’re not trading the current stated rates as much as future rates (and related expectations). With the Fed getting closer to the neutral rate, and the ECB not having raised rates at all yet, there’s simply more room to build expectations around the Euro should stimulus taper go off without a hitch and should the bank be able to avoid some of these exogenous threats such as Italian politics or the situation in Turkey. Or, to put it otherwise, outside of a risk aversion scenario, Euro may hold more bullish promise simply by the number of hikes that the ECB would need to move towards normalization while the Fed is already close to the neutral rate. So, again, risk aversion seems to be the bright spot of opportunity for continued gains in the US Dollar from where we’re at right now.
The Bearish Scenario for USD:
This would largely be looking at what happened last year, while expecting something similar to show. This was driven by the prospect of the ECB tapering their stimulus program before eventually hiking rates, and given the above deviation with the Fed moving closer to the neutral rate with the ECB having far more room to hike towards ‘normalization’, this could keep a bid behind the single currency as investors incorporate and position indications towards a. ‘less loose’ policy and b. eventual policy tightening.
This would also be supported by the fact that USD bulls have had every excuse to punch the Dollar higher since late-May but, so far, have fallen flat. On a monthly chart, we can see USD resisting around the 95.00 level after the two-month bullish move in April and May.
US Dollar Monthly Price Chart

Chart prepared by James Stanley
To read more:
Are you looking for longer-term analysis on the U.S. Dollar? Our DailyFX Forecasts for Q3 have a section for each major currency, and we also offer a plethora of resources on USD-pairs such as EUR/USD, GBP/USD, USD/JPY, AUD/USD. Traders can also stay up with near-term positioning via our IG Client Sentiment Indicator.
Forex Trading Resources
DailyFX offers a plethora of tools, indicators and resources to help traders. For those looking for trading ideas, our IG Client Sentiment shows the positioning of retail traders with actual live trades and positions. Our trading guides bring our DailyFX Quarterly Forecasts and our Top Trading Opportunities; and our real-time news feed has intra-day interactions from the DailyFX team. And if you’re looking for real-time analysis, our DailyFX Webinars offer numerous sessions each week in which you can see how and why we’re looking at what we’re looking at.
If you’re looking for educational information, our New to FX guide is there to help new(er) traders while our Traits of Successful Traders research is built to help sharpen the skill set by focusing on risk and trade management.
--- Written by James Stanley, Strategist for DailyFX.com
Contact and follow James on Twitter: @JStanleyFX


