


US Dollar Talking Points:
- The US Dollar is dropping after putting in a test of a familiar area of resistance, taken from the same zone that held the highs through June and July around the 95.50 level. This comes after a strong bounce from support began last week, helping to soften an August reversal that quickly saw USD lose the entirety of the currency’s earlier-month gains.
- GBP/USD strength has been unable to hold support and sellers quickly reversed last week’s bullish breakout in the pair; indicating that any bigger-picture reversals of the four-month bearish trend in GBP/USD will need to be coupled with a bigger-picture breakdown in the US Dollar. EUR/USD, meanwhile, has seen sellers come back as well, although losses were contained after prices bounced from a similar support area from the last few months, taken from just above the 1.1500 psychological level.
- DailyFX Forecasts on a variety of currencies such as the US Dollar or the Euro are available from the DailyFX Trading Guides page. If you’re looking to improve your trading approach, check out Traits of Successful Traders. And if you’re looking for an introductory primer to the Forex market, check out our New to FX Guide.
Do you want to see how retail traders are currently trading the US Dollar? Check out our IG Client Sentiment Indicator.
US Dollar Falls After Failed Test of June, July Resistance Around 95.50
Last week’s support bounce in the US Dollar has continued to hold into early-September trade, and the Greenback is now pulling back after a test of an area of prior resistance that carried considerable weight during June and July. The remainder of this week’s economic calendar has multiple items of interest around USD with the highlight being Friday’s Non-Farm Payrolls data, so we’ll likely see the currency remain in the spotlight into this week’s close.
US Dollar Daily Price Chart: Re-Testing 95.50 Resistance
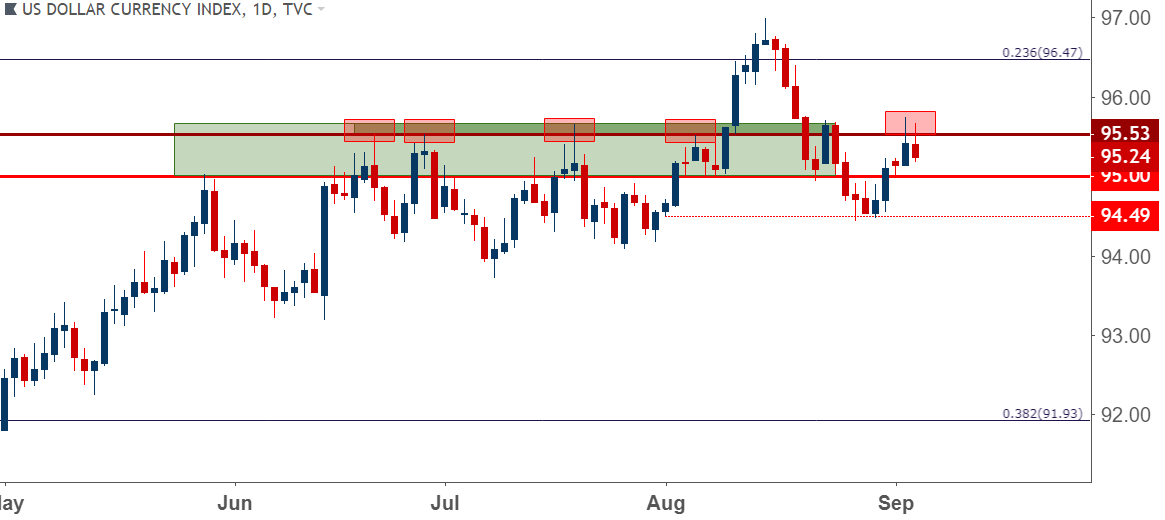
Chart prepared by James Stanley
On a shorter-term basis, the backdrop for continued gains remains with prices re-engaging above the key psychological level of 95.00. Yesterday morning saw a bit of resistance develop off of the 50% marker of the bearish move that showed in the second half of August, and a pullback from that level is now testing support at prior resistance. This keeps the door open for bullish strategies should support hold above the 95.00 level; and a break back-above that 50% marker would open the door for a challenge of the 96.00 level followed by the 96.47 area, which played in as a key level in the month of August.
US Dollar Hourly Price Chart

Chart prepared by James Stanley
EUR/USD Declines Stall at Key Level
The month of August was an interesting one for EUR/USD, as the pair spent the first-half of the period selling-off only to spend the second half clawing back a large portion of those losses. Not all losses were clawed back, however, as a late-month ramp of selling drove prices-lower off of a big zone of resistance that we’ve been following around the July swing-highs. This comes in around the 38.2% Fibonacci retracement of the 2017 up-trend in EUR/USD, which is confluent with the underside of the bullish trend-line taken from early last year.
EUR/USD Daily Price Chart: August Resistance Reaction
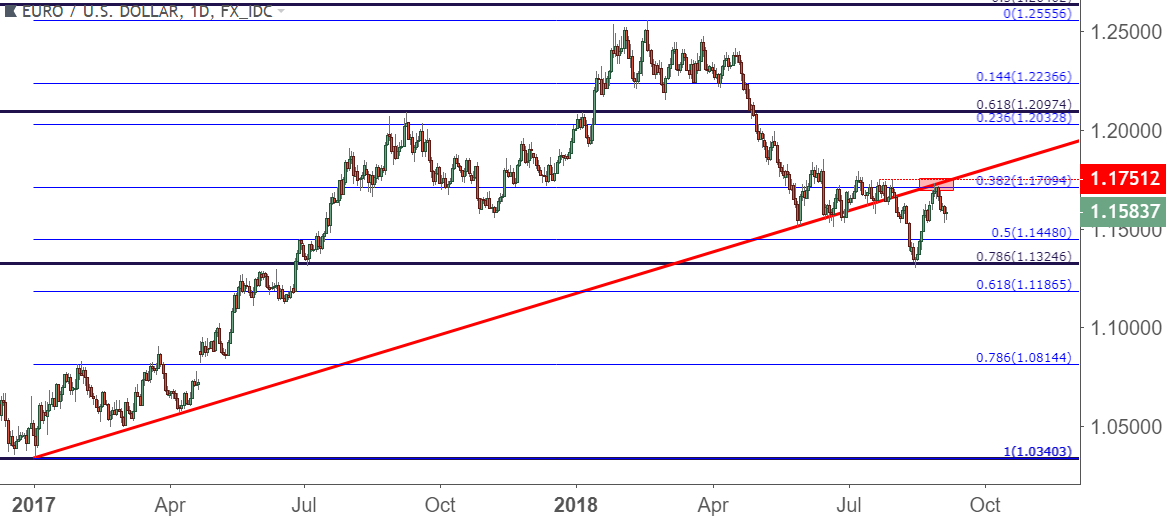
Chart prepared by James Stanley
Similar to what was seen in May, June and again in July, selling pressure appeared to ease as prices re-approached the 1.1500 psychological level. Yesterday saw a bit of swing support develop around 1.1530, which was the same area that had given us a swing in early-August before the big bearish move showed up. Of course during that instance, we had building fears around Turkey and European banks’ exposure to the situation, and that’s what finally gave the pair the motivation it needed to take-out 1.1500, if only for a week-and-a-half before prices snapped back.
EUR/USD Four-Hour Price Chart: Support in a Familiar Area
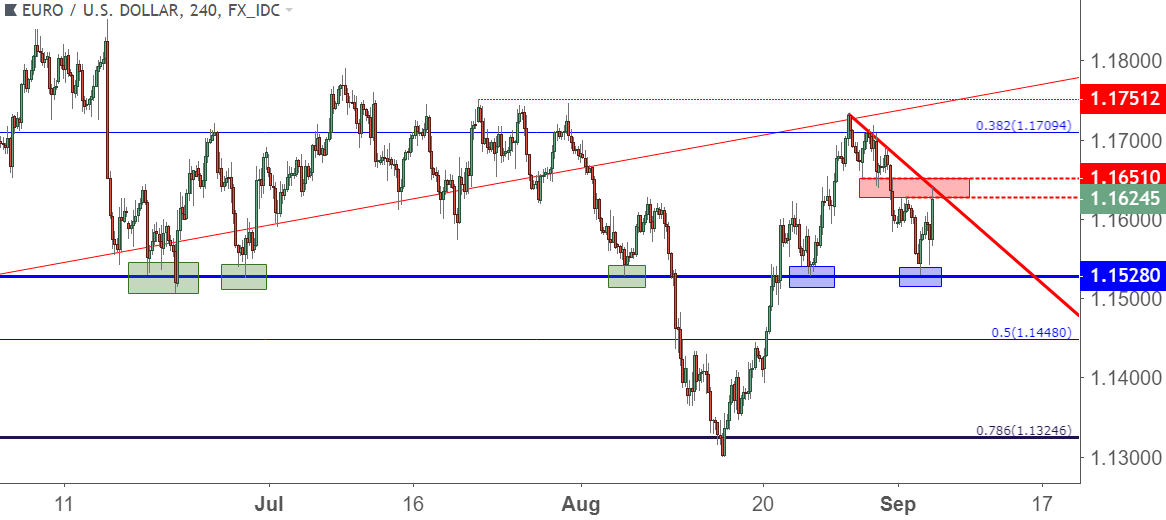
Chart prepared by James Stanley
On an even shorter-term basis, the door could appear open for bearish continuation after last week’s push off of resistance. The big area of interest at this point would be around 1.1630-1.1650, which is this week’s swing-high connected up to last Wednesday’s swing-low; and a re-break above this area would negate the bearish trend-line that built off of last week’s price action; thereby re-opening the door for topside EUR/USD strategies. A hold of resistance, however, could keep the door open for near-term bearish strategies in the pair.
EUR/USD Hourly Price Chart

Chart prepared by James Stanley
GBP/USD: Cable Recovery in Question
Probably the most notable item from last week was the bullish breakout in GBP/USD after supportive comments from the EU’s Chief Negotiator, Michael Barnier. This seemed to indicate that the EU would be open to a post-Brexit partnership with the UK, helping to minimize fears around Hard Brexit or No-Deal Brexit scenarios. This positive boost to Brexit sentiment helped GBP/USD quickly jump above the 1.3000 level, and this held as we moved into Friday trade. But that strength started to slip into last week’s close and the pullback has continued into a fresh week, with prices finding a bit of support off of the 1.2800 handle.
GBP/USD Four-Hour Price Chart: Bounce From 1.2800
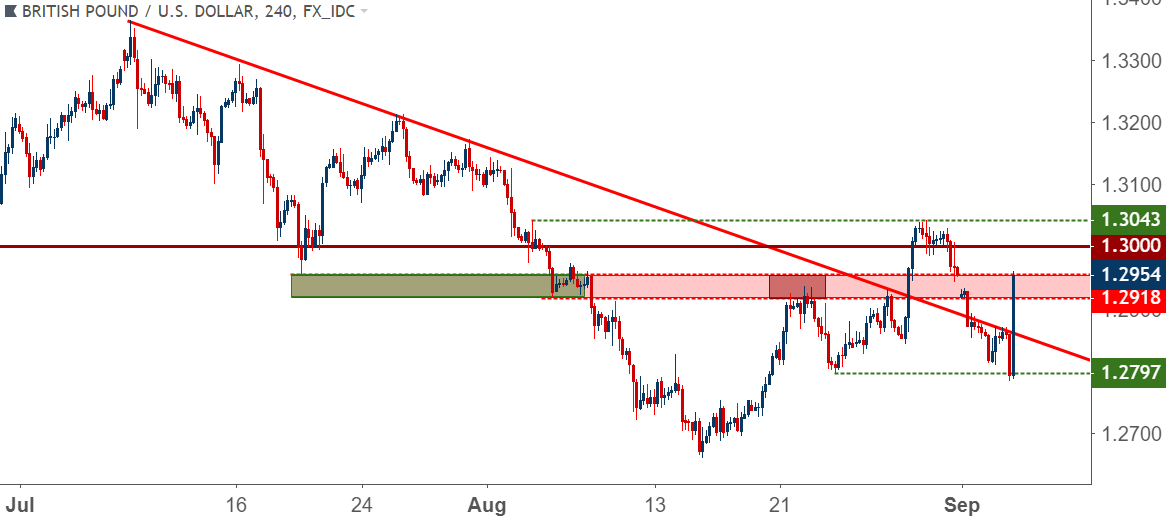
Chart prepared by James Stanley
At this stage, it’s becoming increasingly difficult to muster longer-term bullish leanings on the pair, particularly after last week’s topside run was so quickly snuffed out. The scenario in which Cable strength could become attractive again would likely need to be coupled with a bigger-picture breakdown in the US Dollar; and pushing back-above 1.3000 could be a key variable to watch in the continued development of that theme.
GBP/USD Four-Hour Price Chart: Messy Near-Term, Break-Above 1.3000 a Bullish Indication

Chart prepared by James Stanley
To read more:
Are you looking for longer-term analysis on the U.S. Dollar? Our DailyFX Forecasts for Q3 have a section for each major currency, and we also offer a plethora of resources on USD-pairs such as EUR/USD, GBP/USD, USD/JPY, AUD/USD. Traders can also stay up with near-term positioning via our IG Client Sentiment Indicator.
Forex Trading Resources
DailyFX offers a plethora of tools, indicators and resources to help traders. For those looking for trading ideas, our IG Client Sentiment shows the positioning of retail traders with actual live trades and positions. Our trading guides bring our DailyFX Quarterly Forecasts and our Top Trading Opportunities; and our real-time news feed has intra-day interactions from the DailyFX team. And if you’re looking for real-time analysis, our DailyFX Webinars offer numerous sessions each week in which you can see how and why we’re looking at what we’re looking at.
If you’re looking for educational information, our New to FX guide is there to help new(er) traders while our Traits of Successful Traders research is built to help sharpen the skill set by focusing on risk and trade management.
--- Written by James Stanley, Strategist for DailyFX.com
Contact and follow James on Twitter: @JStanleyFX


