


Talking Points:
- The U.S. Dollar is continuing to pull-back after running into a confluent zone of long-term resistance to end November. This opens the door for trend continuation setups.
- EUR/USD remains volatile after this weekend’s Italian referendum, and we’re not done yet as the European Central Bank may drive volatility around their widely-awaited meeting on Thursday.
- If you’re looking for trading ideas, check out our Trading Guides.
To receive James Stanley’s Analysis directly via email, please sign up here.
The U.S. Dollar’s move in the month of November was noteworthy. The Greenback staged a +6.5% incline, peak to trough, but perhaps most significant was the fact that the currency was finally able to break above a resistance level that had twice before thwarted the Dollar’s advance (in March and December of 2015).
The turning point in this move was the U.S. Presidential Election. The currency initially dropped as it became clear that Donald Trump would likely win; but at around midnight on the night of the elections, support came in and the Dollar-surge began. In the three weeks following, the Greenback remained strong, shredding through resistance levels and continuing to run-higher. But on Thanksgiving (the 24th of November), the Dollar hit a level of resistance that it hasn’t yet been able to eclipse. And after another attempt at taking out resistance last Wednesday, sellers have begun to show as prices are beginning to drip-lower.

Chart prepared by James Stanley
So, while the U.S. Dollar is still in a pronounced up-trend, it appears that we’re in a retracement phase of the move; and the trader’s objective here will often be to look for that ‘lower-high’ before the trend-continuation trade is ready to trigger. This will often happen after a quick and aggressive move, as there are likely many traders who still want to jump-in the trend, but the rapid advances in price make entry a more-distant prospect. Combine this with the fact that many of the bulls that are already long in the position are likely wanting to take some profits as price hovers near resistance after a big jump, and the rationale for resistance showing is very logical. But - as prices move-lower, those buyers on the sidelines become more and more incentivized to buy (same uptrend as before, only cheaper) until eventually enough buyers come-in to the market to off-set sellers, and this is when the up-trend can then resume.
The big question is at which point at which buyers will take-over sellers, or to put it another way, where will the ‘higher-low’ point of support come-in? On the chart below, we look at two potential areas that traders can watch for support on the U.S. Dollar.

Chart prepared by James Stanley
One of the contributors to the Dollar’s recent weakness has been an exuberantly strong Euro, and this is another currency that’s been impacted by Geo-political risk after this weekend’s Italian referendum. And this market is likely not done, as a widely-awaited ECB meeting is on the calendar for this Thursday.
We walked through price action in EUR/USD to open this week in yesterday’s article entitled, Geo-Political Risk to Remain in the Headlines, and as we looked at, EUR/USD ran into a significant zone of long-term support around the 1.0500 handle just after the results of that Italian Referendum came-in. Around this zone we have a) support of a bear-flag formation that’s now been active for over 21 months on EUR/USD, b) the December 2015 low at 1.0516, c) the major psychological level at 1.0500, and d) the March 2015 low at 1.0462, which is also the 13-year low in EUR/USD. With so many elements of support packed together in a small area, we can call this a ‘confluent’ zone of support that, at least thus far, has been able to rebuke the declines in Euro, even in light of another Geo-Political risk factor flaring.

Chart prepared by James Stanley
On the chart below, we’re looking at the near-term setup in EUR/USD after yesterday’s burst of strength. We’ve outlined three support levels, and three potential resistance levels for traders to keep an eye on for forward-looking plays. Keep in mind that Thursday’s ECB meeting can change matters here significantly; and should Mr. Draghi offer aggressive-enough comments towards the prospect of even more QE, this floor of support may finally give-way.

Chart prepared by James Stanley
Another market that’s remained volatile around this recent run in the U.S. Dollar has been USD/JPY. And while many pairs are showing some element of retracement as the Dollar pulls back, the trend in USD/JPY has remained strong. This is indicative of the potential follow-thru impacts of monetary divergence should this theme of strength in USD continue; but given the fact that price action has been unable to make new highs, we can deduce that the trend, at least at this point, is a bit overbought after a really big move in November. But just because something is overbought, it doesn’t mean that prices have to move lower because there is still that potential for follow-thru impact of that continued divergence between USD and JPY spot rates. This means that we’ll likely need a catalyst or motivator of some kind, and with a trend that’s been running as hot as what we’ve seen in the Greenback, that next wave of continuation may always be right-around-the-corner.
On the chart below, we look at this overbought-surge in USD/JPY along with two potential support levels for traders to look for that next ‘higher-low’ in the effort of trend continuation.
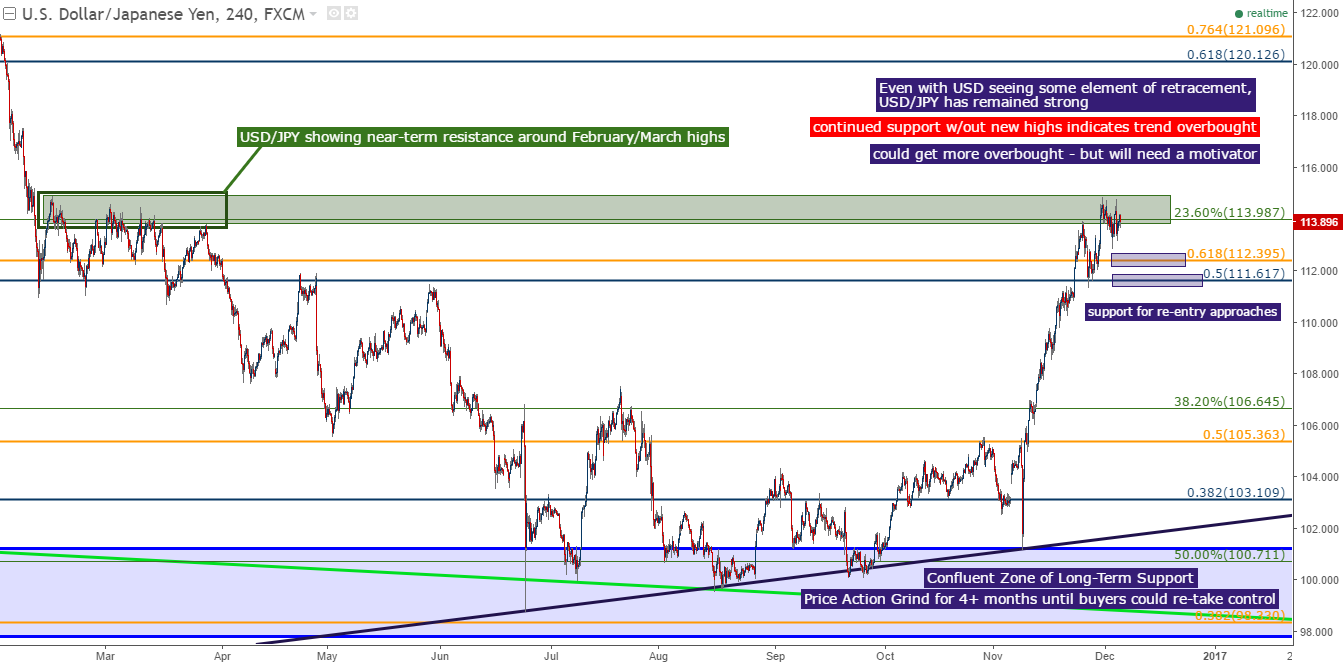
Chart prepared by James Stanley
--- Written by James Stanley, Strategist for DailyFX.com
To receive James Stanley’s analysis directly via email, please SIGN UP HERE
Contact and follow James on Twitter: @JStanleyFX


