


Talking Points:
- To close out September, we looked at two longer-term technical formations in both Oil and USD/JPY under the premise of looking for longer-term reversals. Those setups are still both ‘active’ and of interest, and if you’d like to read more, please check out the article, Oil, Yen and the Prospect of Fresh Trends.
- There is considerable headline risk this week. We discussed the Central Bank meetings on the docket for this week in Friday’s piece – but since then we’ve had political developments open up in both the U.S. and the U.K. To read more about that, please check out Christopher Vecchio’s morning piece, GBP & USD Emerge after Weekend of Tumult on the Newswires.
-If you’re looking for trading ideas, check out our Trading Guides.
To receive James Stanley’s Analysis directly via email, please sign up here.
The headlines have been rather loaded over the weekend, and this week’s data is likely to keep them buzzing. On Friday we previewed four significant Central Bank rate decisions for this week. And while no actual moves are expected on rates from any of these four Central Banks, what they say about how they’re looking to manage their individual economies in the coming months could have a profound impact on near-term price action.
Thickening the drama around this week’s economic calendar are political developments in both the U.S. and the U.K. In the U.K., BoE Governor Mark Carney’s future at the head of the bank has come into question in response to mounting political pressure post-Brexit. And in the United States, another scandal with a Presidential nominee has raised numerous questions about the trajectory of upcoming elections, which are set to take place just a little over a week from today.
So, while many traders were already expecting this week to be prone to volatility, recent developments for each of the above political situations could magnify those risks significantly. With such risk factors flaring, we’ll often see a response of risk aversion across markets. This means lower liquidity, and when we have lower liquidity, this can make price movements sharper as there are fewer sitting orders in the market to serve as a ‘buffer’ to offset rising or falling prices.
Below, we look at three markets that are likely to see significant volatility this week.
One of the initial responses to news of yet another Federal Investigation (or the old investigation being re-opened, more accurately) was US Dollar weakness. This led many to make the connection that one particular Presidential candidate was Dollar-negative while the other was USD-positive.
Be careful with that…
The likely explanation for Friday’s price action in the Greenback is simply that something unexpected happened. Markets do not like uncertainty. Uncertainty is risk. And if risk isn’t compensated with potential reward, it makes no sense to take that risk. So when something new happens (i.e., a risk), institutional traders need to take notice. Given that USD-strength has been building throughout October as investors got more comfortable with the idea that the Fed might be raising rates in December, this introduction of a new, fresh risk factor of this re-opened investigation could’ve been enough to stymie that theme of USD-strength on the back of higher rate expectations. This doesn’t mean that it will be a lasting theme nor does it denote how much continuation potential could be behind it: It simply means something new happened and needs to be watched for further development.
One of the more attractive ways to play USD-weakness throughout 2016 has been in Gold. Gold prices have retained a long-term bullish structure, even despite an aggressive near-term sell-off. That near-term sell-off really kicked into high gear earlier in October as various Fed members talked up the prospect of hiking rates in 2016. This gave the illusion that, despite middling or even questionable U.S. economic data, the Fed was going to try to ‘normalize’ policy. Further – this also gave the impression that the bullish run in Gold might be over as the Fed appeared persistently walking towards policy normalization after years of record-low rates had been unable to fire-up inflationary pressure.
On the chart below, we’re looking at two very different themes in Gold prices. The first bearish move saw a break through the under-side of a bull flag formation in the early part of October – sending prices all the way down to find support at the pre-Brexit low around the $1,250 marker. But since mid-October, Gold prices have been trying to claw-back previous losses, putting in ‘higher-highs’ and ‘higher-lows’ until finding near-term resistance at a confluent batch of Fibonacci resistance around the $1,285-zone.

Chart prepared by James Stanley
The Yen
Another market likely to see heightened volatility this week is the Yen. The Bank of Japan is hosting a widely-watched meeting later tonight, and the ‘good news’ is that expectations are relatively low for any new announcements of fresh stimulus. The likely driver out of this meeting will be in the details of what BoJ Governor Kuroda discusses pertaining to future monetary efforts. Negativity or skepticism around the bank’s current inflationary targets will likely bring on Yen weakness under the presumption that, eventually, the BoJ will be coming to the table with more stimulus.
The prospect of a prolonged reversal is exciting on a technical basis, as there is a long-term trend-line that has helped to set support over the past four months. Below, we’re looking at the monthly chart in USD/JPY.

Chart prepared by James Stanley
And on the chart below, we’ve zoomed in to the Daily chart to highlight the fresh high’s that have been printing in USD/JPY as we approach tonight’s BoJ meeting.
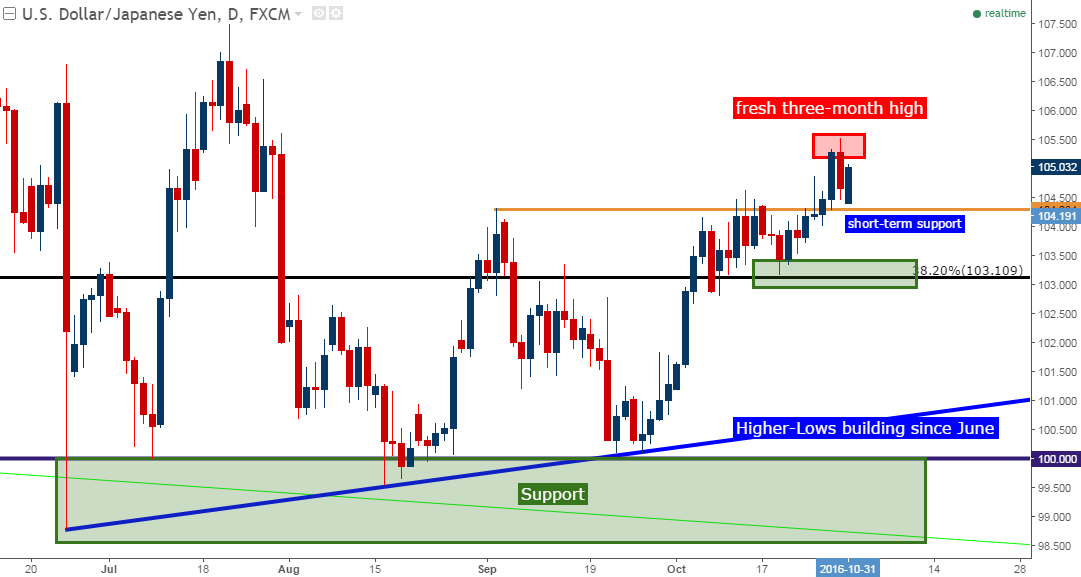
Chart prepared by James Stanley
Another long-term trend-line is ‘in play’ at the moment, and this one is in Oil. We had discussed this setup a month ago in the article Oil, Yen and the Prospect of Fresh Trends. This trend-line began in October of 1998, and is connected with the swing-low in November of 2001. The projection of this trend-line caught the lows of the Financial Collapse and again showed as support earlier last year. But since prices fell below this trend-line in Q4 of 2015, this old level of support has continually been showing up as resistance: Below, we take a look at the monthly chart of WTI Oil.
Given that price action has been unable to close above the prior swing high at $51.64, this setup would still be actionable, particularly if short-term resistance holds.
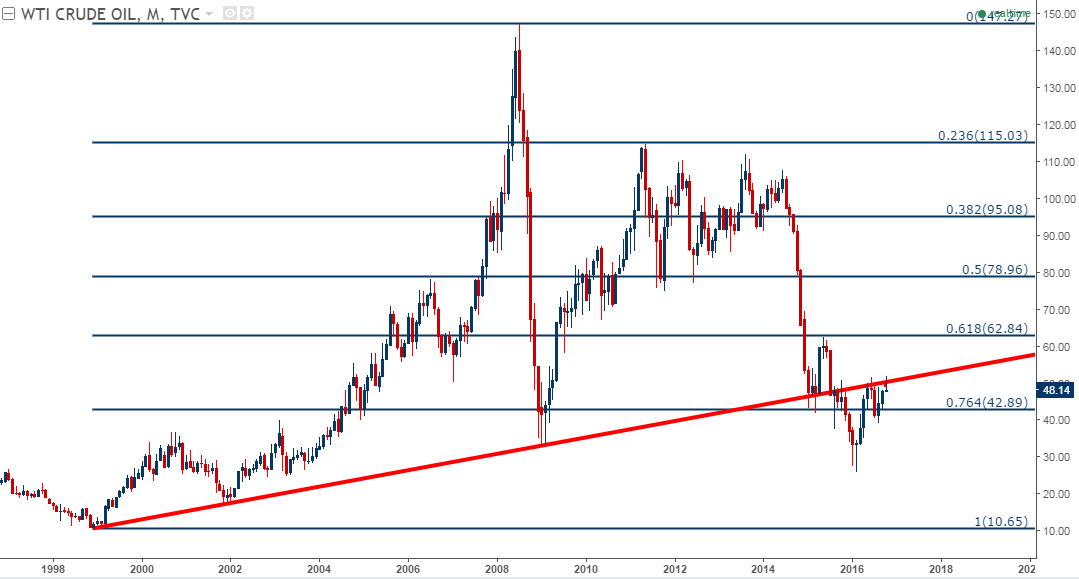
Chart prepared by James Stanley
Given that price action has been unable to close above the prior swing high at $51.64, this setup would still be actionable for a bearish reversal, particularly if short-term resistance holds. On the chart below, we’re looking at the 4-hour setup in Oil as short-term support has been giving way to falling prices.
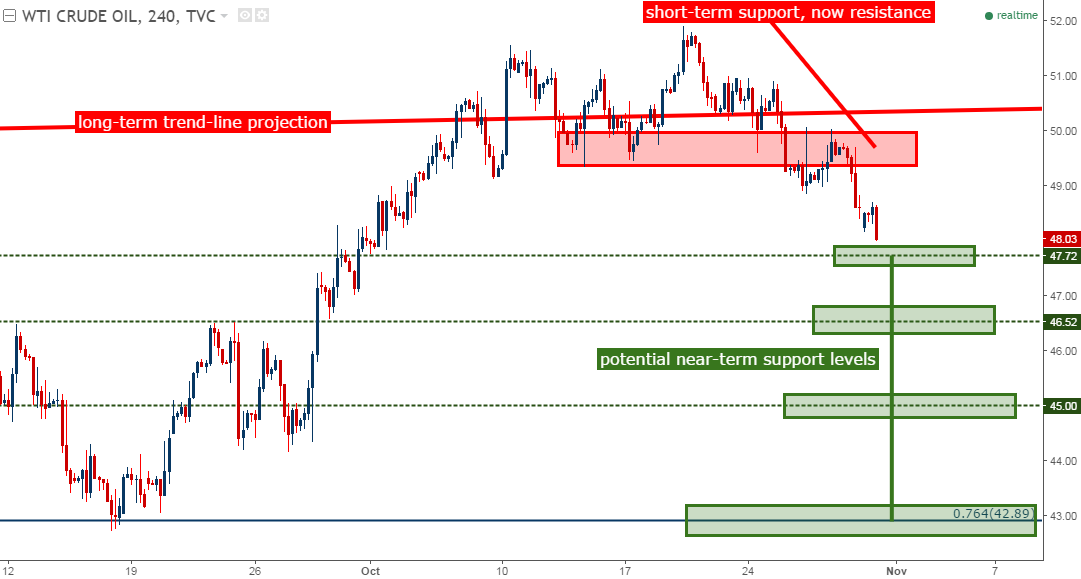
Chart prepared by James Stanley
--- Written by James Stanley, Analyst for DailyFX.com
To receive James Stanley’s analysis directly via email, please SIGN UP HERE
Contact and follow James on Twitter: @JStanleyFX


