


Talking Points:
- Oil just intersected with a major psychological level at $50 for the first time in seven months. These rounded, whole numbers will often have a tendency to show support/resistance.
- The US Dollar has posed a tenuous break below the price action box that we looked at yesterday. And EUR/USD has moved up to a pivotal area of support/resistance. Should USD find support today, this short EUR/USD setup could be attractive.
- If you’re looking for trading ideas, check out our Trading Guides. And if you want something more short-term in nature, check out our SSI indicator. If you’re looking at opening a trading account, FXCM has a contest at the beginning of next month for certain account holders. Click here for full details.
Oil Touches $50 for the First Time in Seven Months: This is the headline move of the day, and you’ll likely be reading more about this over the next 24 hours. While lower Oil prices had essentially become a foregone conclusion in Q1 of this year, a screaming comeback after Chair Yellen’s Congressional testimony on February 11th has brought prices back above to the psychological $50-handle.
What’s so significant about the price of $50? Nothing really: It’s merely a flat, rounded number, and many human beings think in terms of round numbers. As in, if I ask someone how much they paid for their car, they’re probably going to say ’35,000’ as opposed to an exact figure like ’34,976.34.’ This is just practical ease of simplicity in thinking and communication, and this also takes place in markets where traders will use these rounded values for sitting orders (such as stops, limit-entries, etc.), and this can in-turn shape price action as these sitting orders become executed as prices trigger through significant levels. For a full description behind psychological support and resistance levels, please read our article, ‘The Hidden Patterns of Support and Resistance in the Forex Market.’
We’re currently seeing this take place with the $50-handle on Oil prices. For traders that want to load up on the long side of the move, triggering long so near a potential resistance level would likely be unattractive. A bit lower at $48.61 is the 38.2% Fibonacci retracement of the recent major move, taking the May 2015 high to the February 2016 low; and this is a level that had provided the most recent short-term swing high.
On the chart below, we’re looking at the current price action setup in Oil. After the $50-handle, there are three interesting areas to watch for potential resistance until the prior swing high at $62.56 comes into play; at $50.90 we have the October 2015 swing high, and currently projecting to approximately $53.20 we have a projected trend-line that can be found by connecting the December 1999 low to the November 2001 low. Then at $53.94 we have the 23.6% retracement of that most recent major move (taking the $62.56, May 2015 high down to the February lows).
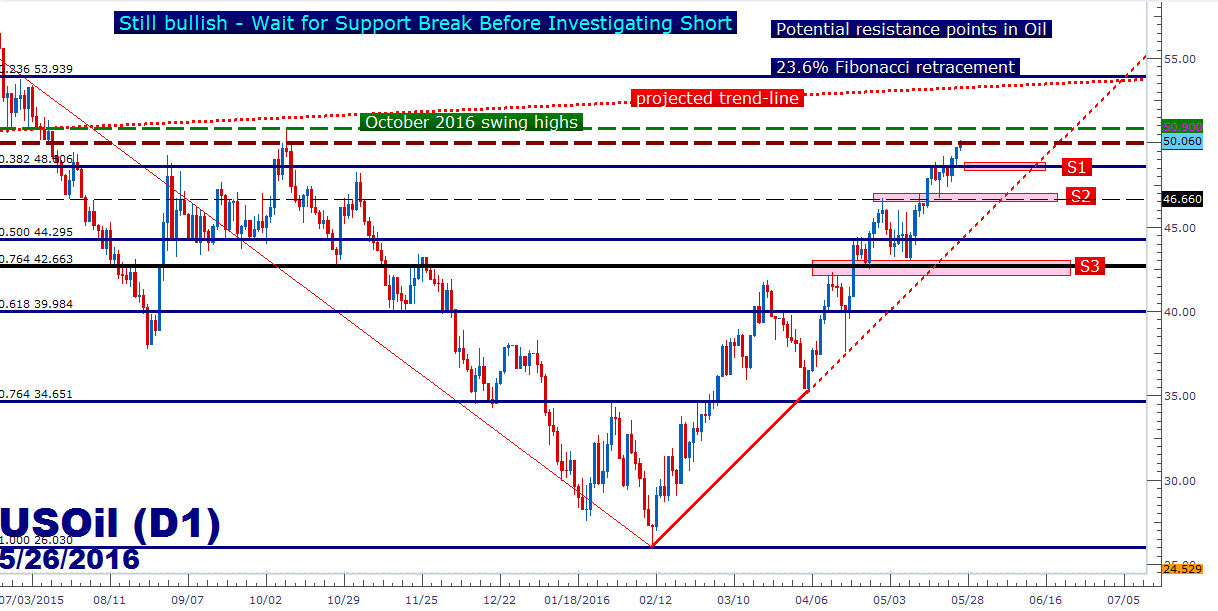
Created with Marketscope/Trading Station II; prepared by James Stanley
USD Slipping, but Intermediate Term Still Bullish Until This Gives Way
In yesterday’s article we wrote about the box formation that had built in the US Dollar over the previous five trading days. As we mentioned, with multiple Fed speakers on the docket combined with some US Data, it was likely we would get a break of that box in one direction or the other rather soon. That break finally came in, albeit tenuously, and this was despite the fact that rate expectations out of the United States have continued to rise. So this bearish move may be fleeting in nature: The longer-term move is still bullish and will remain as such until support breaks at the 11,898 level, which is the 50% Fibonacci retracement of the prior major move. Until that support shows, traders can look to sell USD against strong currencies like the British Pound. But, once support does show up, traders can look to do the opposite by buying USD against weak currencies, like the Euro.
On the chart below, we’re looking at the updated setup in USD, and a bit below that we’re looking at the updated EUR/USD chart that we had investigated yesterday.

Created with Marketscope/Trading Station II; prepared by James Stanley
As we mentioned yesterday, the move in EUR/USD had proffered a break through a pivotal support level at 1.1212, as this is the 61.8% Fibonacci retracement of the ‘lifetime move’ in EUR/USD. This is also a level that’s provided significant support/resistance over the recent past. Traders can watch price action today to ensure that resistance will, in fact, hold. If it does, this could be an attractive way of getting long USD after a quick burst lower.

Created with Marketscope/Trading Station II; prepared by James Stanley
--- Written by James Stanley, Analyst for DailyFX.com
To receive James Stanley’s analysis directly via email, please SIGN UP HERE
Contact and follow James on Twitter: @JStanleyFX


