


Talking Points:
- The dramatic drop in the price of Oil has exposed a large portion of debt taken on by banks to finance expansion while rates were low and money was cheap.
- As oil prices fall further, this squeezes producers’ margins; in many cases beyond the point of break-even; and this makes the debt taken on by banks to finance energy exploration vulnerable.
- Some banks have already begun speaking on the topic of energy debt exposure in the effort of assuaging worried investors, and as of right now, we know about approximately $323 Billion of debt exposure; but many banks haven’t disclosed an amount, and a fragile European banking sector appears vulnerable should Oil prices fall back below $30/barrel.
The biggest risk often isn’t the one that we can see; but it’s the risk that we think we know but actually don’t. The 1987 Savings & Loan Collapse was like this, as was the 2000 tech bust and the 2008 Housing Collapse. While these bubbles were building, each and every time investors left prudence behind and chased prices higher and higher until eventually there was no one left to buy. And this is when prices begin to come down. This doesn’t necessarily spell an immediate end to the trend, as there are still those chasing the prior move that can give prices brief moments of support before even more selling ensues.
It’s only once fear permeates a market that capitulation may take place. Over the past six months we’ve had two similar such scenarios begin to show across financial markets. The concurrent impact of a slowdown in China combined with utter carnage in Oil prices has been too much for capital markets to bear; and while the world has backed away from the cliff in both of those instances over the past six months; if history is any guide, this is likely more of an indication of what might happen in the not-too-distant future rather than us having seen two isolated, random occurrences in which equity swung by 10-20% within a couple of months.
But just like we saw in 1987, and 2000, and 2008; the risk that will shape price action moving forward likely isn’t one we already know about: China and Oil are already well known risks just like sub-prime housing loans were a well-known risk in 2007. It was the risks that we thought we knew then (sub-prime) that exposed the ones we didn’t (credit market contagion). On the below chart, we look at the timeline of how the Financial Collapse took place. The warnings were coming in as early as February of 2007 when Freddie Mac said they would no longer buy the riskiest sub-prime loans. Six months later, mortgage giant Country wide got downgraded by the rating agency, Fitch. The risks of sub-prime were known at this point; but it took almost a year before we saw full-scale capitulation begin.
Timeline of the Financial Collapse as Reflected in the S&P 500

Created with Marketscope/Trading Station II; prepared by James Stanley
What caught the world by surprise in 2008, and what made the Financial Collapse the ‘Financial Collapse’ rather than just some write downs of sub-prime debt was the contagion element. This is what the world wasn’t expecting; that sub-prime loans could infect the rest of the credit market. Sub-prime write downs from the Financial Collapse have been tallied at approximately $295 Billion. But the total shockwave of financial destruction was far, far larger, with estimates varying: The IMF says it was about $4.1 Trillion, while a former credit officer at Standard and Poors pegs that value closer to $15 Trillion. The difference between the $295 Billion written off and the total destruction, whichever amount we use, is leverage. And just like leverage can help amplify gains in good times when trends are moving higher, leverage can most definitely amplify losses as well. This is what usually catches the world off-guard. In 1987, 2000 and 2008; same story: Too much debt and far too much leverage coming home to roost.
Right now there is $323 Billion of credit exposure to energy at major banks, and this is just the amount that we know about right now. Some banks (including the most worrisome) haven’t even disclosed an amount. And as Oil prices have continued to languish near multi-year lows, the risk of contagion to the banking sector from energy companies not being able to pay their debt is becoming more and more well-known.
How We Got Here (Again)
A rising tide lifts all boats, as the saying goes. And nowhere is this phrase more relevant than in the discussion of Financial Markets, because if a Central Bank or a government decides to give away free money to their populace, it’s likely that most companies in that economy will benefit to some degree. Even horribly mismanaged, inefficient firms will enjoy some of the benefits of this stimulus measure as consumers rush out to spend this new capital. The rate at which this new capital is re-injected back into the economy is governed by the Marginal Propensity to Consume, or MPC from your Micro-Economics text books, and this capital will continue to flow through the economy as the retail outlets that sold more goods would need to eventually hire more workers; and the very act of hiring more workers means more demand for labor, which pushes up wages; and before you know it we have increasing inflation with decreasing unemployment as actual, substantive growth sets hold in the economy after this initial stimulus injection brought the tide higher and carried all of the boats with it.
This is often referred to as the ‘velocity of money.’ As more capital finds its way into the financial system, this brings a synergistic effect as more spending leads to more hiring which leads to more inflation. It’s a beautiful synergy when it all comes together, and in Economics academia, this is what is supposed to happen with stimulus. It’s supposed to stimulate…
But tides don’t always rise, do they? If they did we’d have a world engulfed by water. Tides, like economic trends, ebb and flow. Long periods of rain give way to extended periods of drought; and it’s during these conditions that the weak and frail companies in an economy become exposed and vulnerable. From a strictly evolutionary sense, these ‘down periods’ can be a good thing as they eliminate weakness and allow for stronger foundations to be built; foundations that will provide the structural integrity of the next trend-higher.
Because just like a rising tide lifts all boats, a deepening drought evaporates all sources of water; and even the mightiest of boats can have trouble staying afloat.
For the past seven years the tide has been almost entirely driven by Global Central Banks. This has driven stocks to new all-time highs and not by a small margin either. Last year the S&P peaked to its all-time high, a full 35.5% higher than the previous high set just ahead of the Financial Collapse. And this wasn’t exactly a period of robust growth as American GDP increased by roughly 12% over the same period of time; and even this was largely aided by multiple rounds of QE.
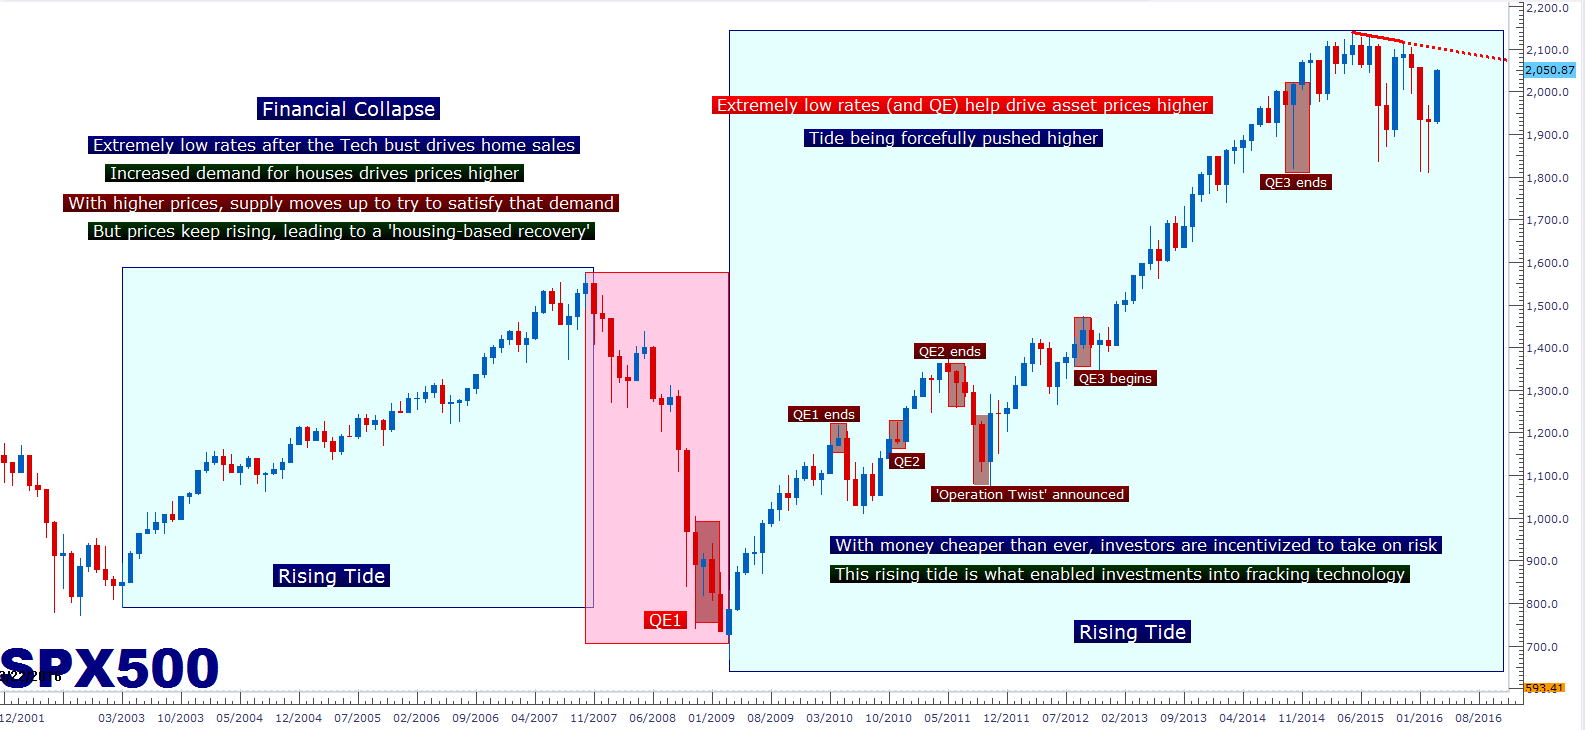
Created with Marketscope/Trading Station II; prepared by James Stanley
During this period of QE-driven gains, banks were essentially given capital with the design to lift the tide by giving out loans while rates were extremely low. The design was for this capital to make its way to regular people in order to build a business, or buy a home or a car; which can then, in-turn, allow for the velocity of money to filter that capital throughout the economy. Hopefully that synergy mentioned earlier would follow with more jobs, lower employment and rising wages. And while this has happened to a lesser degree, we’ve seen something else develop…
Cheap Money Can Change the World
With rates extremely low, so are opportunity costs. This is a guiding tenet of monetary policy, the ability to be able to incentivize investors or market participants by adjusting interest rates as needed. When rates are low, the world is incentivized to invest because there are so many fewer places to store capital. Low rates, or ZIRP, compel investors to take on more risk than they would otherwise, all factors equal. And as long as prices keep going up, it’s hard to notice any drawbacks. It’s only when the tide stops rising that anyone begins to take notice.
One of the largest impacts of ZIRP has been the further development of the energy market in the United States. With rates hovering near all-time lows for so long, a significant amount of investment had been driven to extracting energy. And with oil prices consistently continuing to move higher, it made sense to invest in these areas of the markets; the tide was continuing to rise and it became difficult to imagine a world otherwise. This is when significant amounts of new capital were directed towards companies with new methods for extracting energy, like fracking. In a normal environment with high rates, spending research and development dollars on these newfound methods may have been unattractive because there were so many opportunity costs; but with rates low and opportunity cost minimal, investing in the development of these methods made considerably more sense.
Cheap Money Drove Research and Development into New Energy Extraction Methods
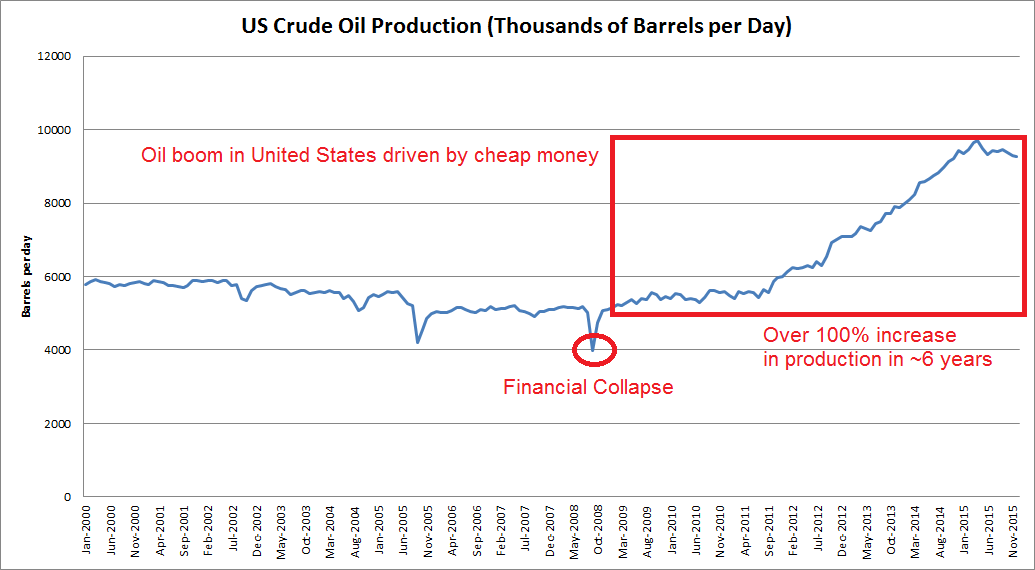
Chart prepared from data provided by US Energy Information Administration (EIA), prepared by James Stanley
In a short six years, the United States became one of the world’s largest energy producers on the back of these new methods of extraction. This meant decreased demand for energy from many emerging market economies, and this also meant a lower price for Oil given the increased supply after the development of new methods like fracking and horizontal drilling.
The Tide Begins to Recede
Supplies can only increase for so long before price becomes impacted. Nobody wants to pay artificially high prices for a commodity that they can easily get for a cheaper price from another venue. This is why over the long-term markets are relatively efficient. And as the US energy boom was creating a whole new realm of supply that was previously unknown about through fracking and horizontal drilling methods, the Oil market saw earth-shaking consequences. Prices dropped dramatically to reflect this newfound supply on the back of the ‘shale revolution’ in the United States.
Cheap Money Drove Investment; Investment Paid Off With Increased Supply – Then Prices Drop
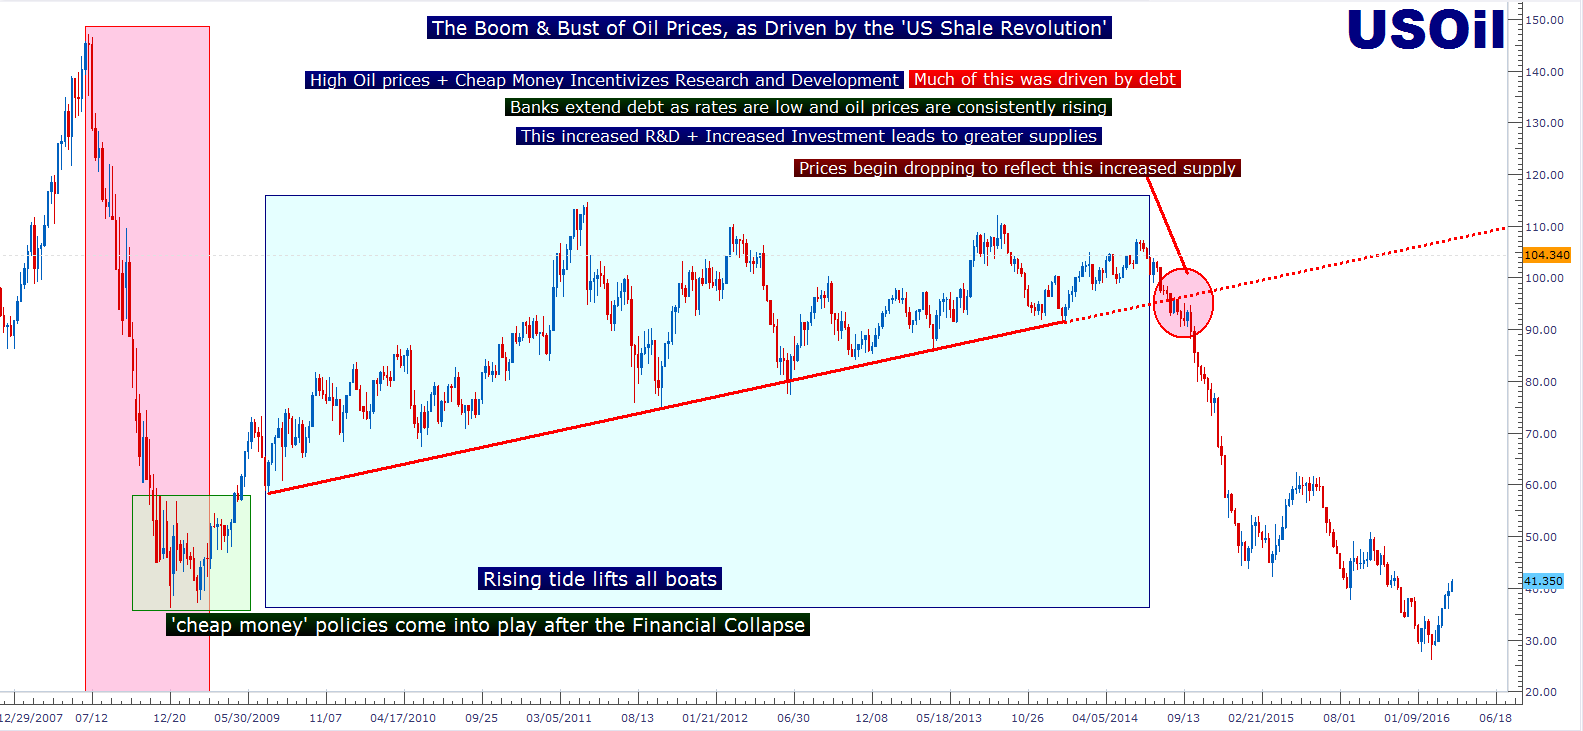
Created with Marketscope/Trading Station II; prepared by James Stanley
As the United States became a net producer of Oil, a significant tidal wave of change hit the energy industry. Established players like OPEC or Russia had new competition, and as supplies increased with a new major player in the market, prices crawled lower. This provided a significant hit to the margins for energy producers.
And not only were energy producers reeling from lower prices, but the debt that had been taken out to finance all of this research and development and these new extraction methods began to become burdensome. Producers were having difficulty breaking even just on the direct costs of extraction, much less considering the heavy overhead costs that were taken on while money was cheap and prices were high.
And just like the sub-prime crisis turned into the Financial Collapse in 2007-2008, the threat of falling oil prices exposes a vulnerable global economy in which many Central Banks are still sitting on ‘emergency-like’ policies a full eight years after the Financial Collapse.
Or, to put it another way, investors are still being incentivized to continue taking on risks despite the numerous warning signs that have already begun flashing.
‘The Looming Boom’
Just like the Financial Collapse, the real worry here isn’t necessarily on the direct target market, in this case Oil and in 2007 sub-prime mortgages. The bigger concern is the domino effect that might take place should Oil prices stay low, oil producers continue to see margins compressed, and banks continue to see increasing non-performing loans as producers continue to struggle to service their already existing debt.
Because this is so close to a very recent event that nearly saw the American banking sector fail to the point of seizure; we’ve already seen numerous American banks speak on this topic during recent investor relation events. A recent Bloomberg article authored by Lisa Abramowicz and Rani Molla collated these projections to put an estimate on this amount: For American banks, that estimate is approximately $123 Billion of energy-based debt exposure.
This is just an estimate, and it may be on the low side. Take Wells Fargo, for instance: CFO John Shrewsberry had previously said that the bank has $17 Billion of loans to the energy industry; but later said that there was also $25 Billion in untapped credit lines that energy customers hadn’t yet used. These credit lines will likely get accessed as margins remain under pressure as energy companies try to cover costs until prices can move above break-even levels.
Perhaps more worrisome, much of this debt is of an extremely low rating already. Nearly three-quarters of Wells Fargo’s exposure is junk-rated. And three of the stalwarts of American banking; JP Morgan, Goldman Sachs and Morgan Stanley are all at 40% junk with their energy exposure. As prices stay low and margins compressed, we’re likely going to see even more downgrades, and this means even more junk as an increasing percentage of this energy exposure gets downgraded to reflect the new reality of increased supplies.
This is not too dissimilar from the Financial Collapse, when many CDO’s (think junky loans packaged together from leftover junk) were holding Triple-A credit ratings even as default rates began increase.
As those credit ratings got downgraded, banks had to mark the value of that debt down. This is the same thing as a floating loss on a trading position that technically doesn’t become realized until the position is closed. Does the failure to close the position mean that the loss isn’t real? No, it merely means that it hasn’t been ‘booked’ or ‘realized,’ it doesn’t make it any less ‘real.’
As much of this debt was downgraded in 2008 and as investors began to shun these investments, banks saw major floating losses from the decreased value of these bonds, and this was a $295 Billion problem. When and if they ‘marked to market’ (valued the loans based on current market value), many of these banks fell near or below capitalization ratios (think closing out a huge floating loss just before you take a margin call). This is why the government had to step in to bail out the banks; because they were forced to realize losses on these bonds that were previously Triple-A rated. The losses incurred by banks and the threat to their capitalization ratios made this $295 Billion problem a $4.5 Trillion nightmare: This was the risk that they thought they knew but very obviously didn’t.
European Banks May Present Even More Risk with Falling Oil and Energy Prices
The European economy has been in a near-constant state of distress, in one form or the other since the start of the European Financial Crisis. Rising unemployment with non-existent inflation while rates have been falling deeper and deeper into negative territory has begun to expose the fragility of the European banking sector.
In the constant search for yield and ROI in a world full of ZIRP (zero interest rate policy), many European banks had doled out loans to energy producers in the eight years since the Financial Collapse. In a recent Bloomberg article, Lionel Laurent looked at a ballpark figure of around $200 Billion taken from banks’ disclosures. But as Mr. Laurent pointed out, some banks haven’t disclosed any amount, leaving investors to wonder how bad the problem really might be. And just as we had seen above with American banks, the true amount of exposure has to be questioned as this $200 Billion figure may not include untapped credit lines which could certainly exacerbate exposure.
This heavier exposure to energy debt has begun to be reflected in equity prices. On the chart below, we look at American banks versus their European counterparts with Oil prices overlaid in Green.

Chart created with Tradingview; prepared by James Stanley
One of the more concerning European banks at the moment is Deutsche Bank, and they haven’t made any disclosures regarding energy exposure. This bank is also carrying approximately $64 Trillion in derivative exposure (that’s trillion, as in more than three times the size of the entire US economy, or about 16 times the size of Germany’s GDP), and we’ve already heard from political leadership in the country in which this bank is domiciled that it will not be bailed out.
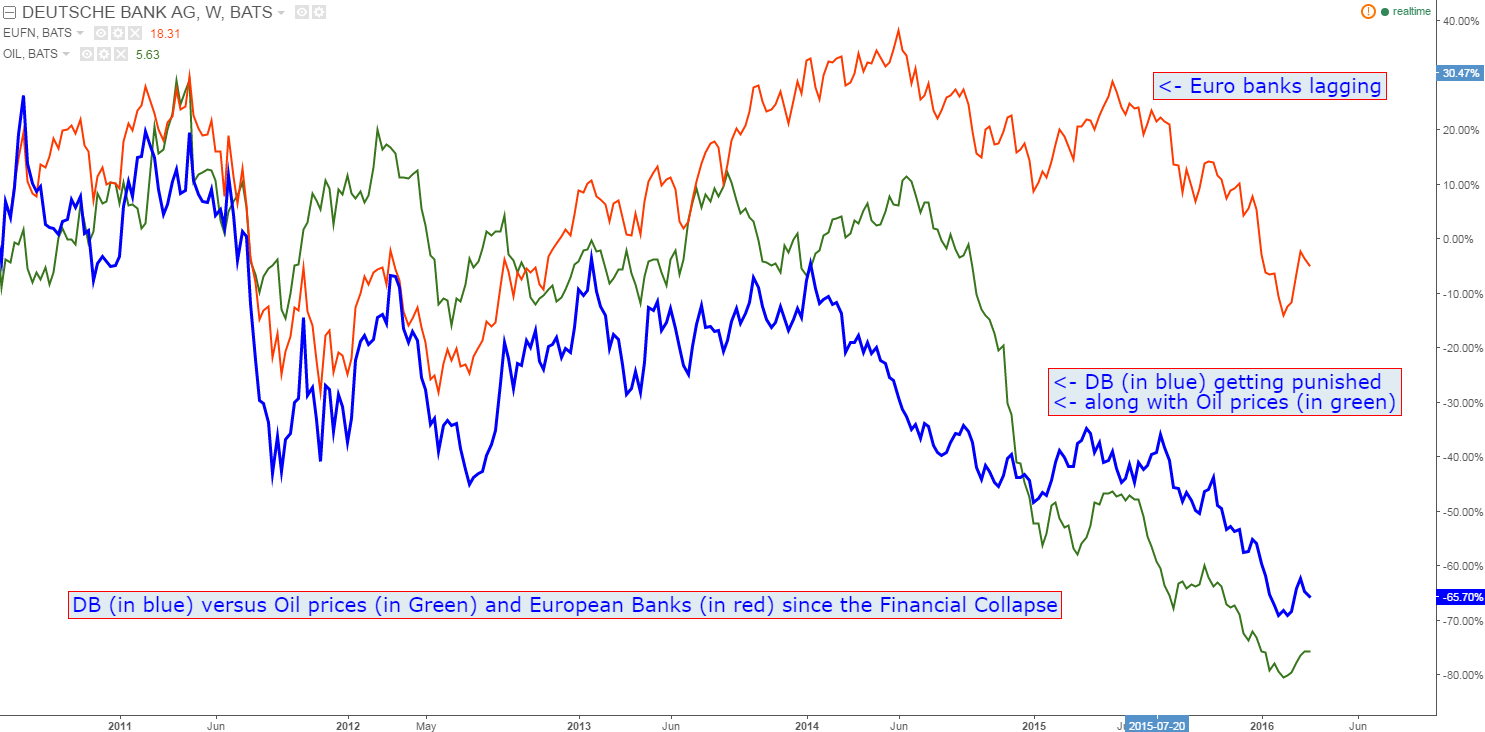
Chart created with Tradingview; prepared by James Stanley
The Problem Isn’t DB or Any Other Single Bank: It’s the Prospect of Contagion
The risk has already been taken on. At this point, many of these banks are as vulnerable to market forces as the producers that fronted that debt. Should Oil fall back below $30/barrel, much of this debt comes into question as many producers are going to be so far below break-even that we’ll likely see increasing bankruptcies in the sector, thereby amounting to even more carnage on banks’ balance sheets as even more debt gets ‘written off.’
And as energy producers continue to face headwinds with Oil prices already at low relative levels, this will likely lead to more and more downgrades. Just like in 2008, this leads to paper losses that don’t become real until the bank faces their own version of a margin call. And that may happen with Oil prices continuing at the low $30’s as increasing downgrades lead to lower credit ratings and higher costs of borrowing, thereby decreasing the probability that a producer will actually be able to ‘weather the storm’ and make good on their debt obligations.
The basic business of a bank is fairly simple: Take deposits from customers, loan some of that money out at a higher rate and pocket the difference as the intermediary. By nature this puts the bank in a vulnerable position because they have to take on leverage to loan money that they don’t technically own. As long as debts are being paid back, this doesn’t really produce any problems. But as more and more debt goes bad, the business-end of that double-edged sword of leverage grows sharper and sharper as losses become more and more magnified; just like in 2008.
Just like the Financial Collapse, this is like the velocity of money, but in reverse: This is the velocity of contraction, and we know that banks are carrying some heavy exposure.
--- Written by James Stanley, Analyst for DailyFX.com
To receive James Stanley’s analysis directly via email, please SIGN UP HERE
Contact and follow James on Twitter: @JStanleyFX


