


- U.K Consumer Price Index (CPI) to Hold at the Highest Reading Since September 2013.
- Core Rate of Inflation to Expand Annualized 2.4% f or Second Month..
Trading the News: U.K. Consumer Price Index (CPI)
Stickiness in the U.K. Consumer Price Index (CPI) may do little to shore up the British Pound as fears of stagflation emerge, and the Bank of England (BoE) may show a greater willingness to preserve the highly accommodative policy stance throughout 2017 as ‘consumption growth will be slower in the near term than previously anticipated.’
Why Is This Event Important:
In light of the market reaction to the last CPI report, heightening price pressures may now fuel the bearish sentiment surrounding Sterling as the BoE remains reluctant to lift the benchmark interest rate off of the record-low. Even though Governor Mark Carney & Co. warn ‘there are limits to the extent to which above-target inflation can be tolerated,’ the ongoing slack in the real economy accompanied by the heightening uncertainty surrounding the fiscal outlook may encourage the BoE to further tame interest-rate expectations especially as ‘wage growth has been notably weaker than expected.’
Have a question about the currency markets? Join a Trading Q&A webinar and ask it live!
Impact that the U.K. CPI report has had on GBP/USD during the previous release
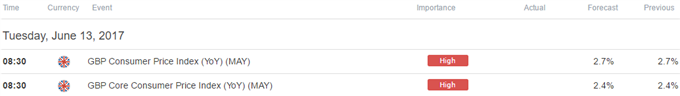
| Period | Data Released | Estimate | Actual | Pips Change | Pips Change |
|---|---|---|---|---|---|
APR 2017 | 05/16/2017 08:30 GMT | 2.6% | 2.7% | -69 | -24 |
April 2017 U.K. Consumer Price Index (CPI)
GBP/USD 5-Minute
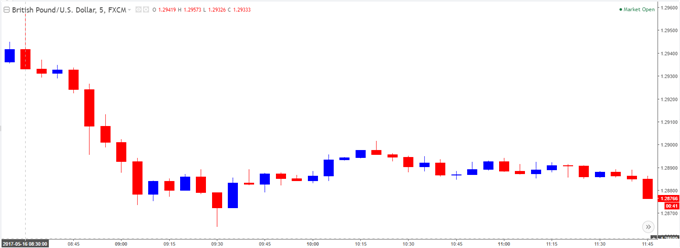
The U.K Consumer Price Index (CPI) climbed an annualized 2.7% in April to mark the fastest pace of growth since 2013, with the pickup led by rising transportation costs accompanied by higher prices for clothing & footwear. The core rate of inflation also beating market expectations, with the reading advancing 2.4% during the same period amid forecasts for a 2.3% print, with the data raising the threat for stagflation as the Bank of England (BoE) warns ‘consumption growth will be slower in the near term than previously anticipated.’ The British Pound struggled to hold its ground following the report, with GBP/USD dipping below the 1.2900 handle, but the pair bounced back during the North American trade to end the day at 1.2918.
How To Trade This Event Risk(Video)
Bearish GBP Trade: Above-Target Inflation Fuels Risk for Stagflation
- Need a red, five-minute candle following the CPI report to consider a short GBP/USD trade.
- If market reaction favors a bearish British Pound trade, sell GBP/USD with two separate lots.
- Set stop at the near-by swing high/reasonable distance from entry; look for at least 1:1 risk-to-reward.
- Move stop to breakeven on remaining position once initial target is met, set reasonable limit.
Bullish GBP Trade: CPI Report
- Need a green, five-minute GBP/USD candle to favor a bullish British Pound position.
- Carry out the same setup as the bearish Sterling trade, just in reverse.
Potential Price Targets For The Release
GBP/USD Daily
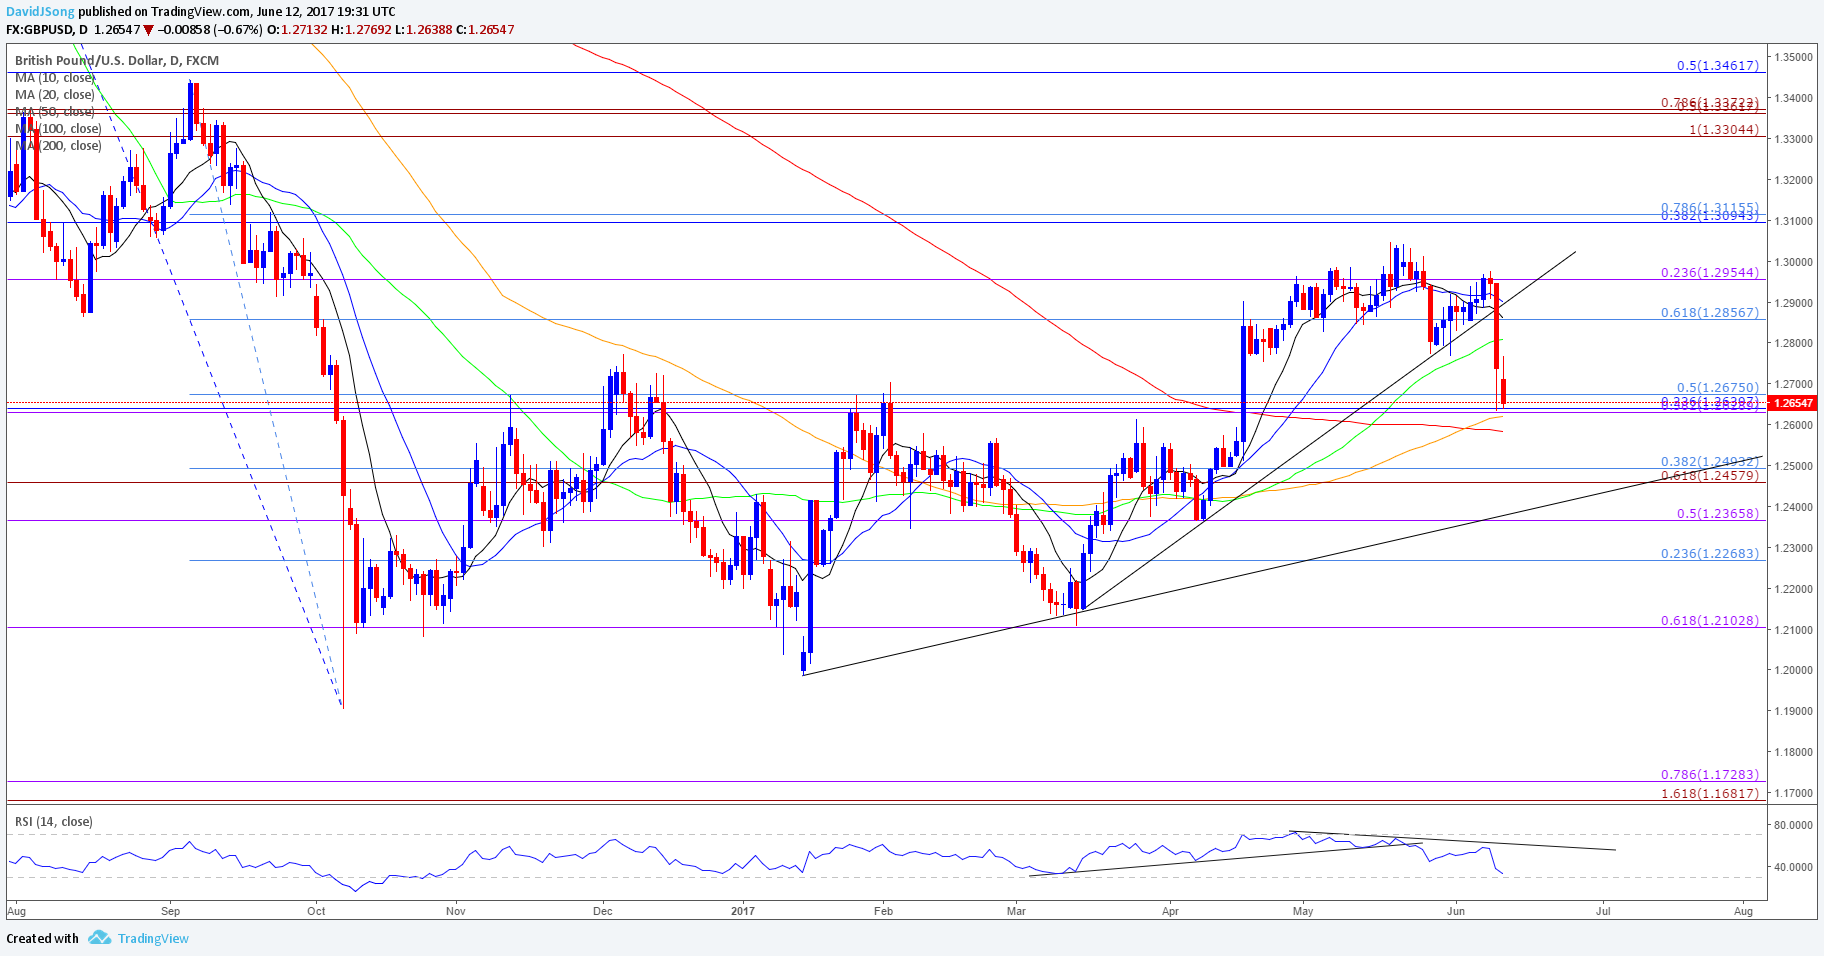
Chart - Created Using Trading View
- Downside targets are back on the radar as GBP/USD fails to preserve the upward trend from March, with the Relative Strength Index (RSI) showing a similar dynamic, but the lack of momentum to break/close below the Fibonacci overlap around 1.2630 (38.2% expansion) to 1.2680 (50% retracement) may produce range-bound prices as the region sits just above the 100-Day SMA (1.2619) and the 200-Day SMA.
- With that said, former-support around 1.2860 (61.8% retracement) should keep prices capped, with the next downside region of interest coming in around 1.2460 (61.8% expansion) to 1.2490 (38.2% retracement)followed by the 1.2370 (50% expansion) hurdle.
- Interim Resistance: 1.3460 (50% retracement) to 1.3481 (July high)
- Interim Support: 1.1905 (2016-low) and 1.2100 (61.8% expansion)
Make Sure to Check Out the DailyFX Guides for Additional Trading Ideas!
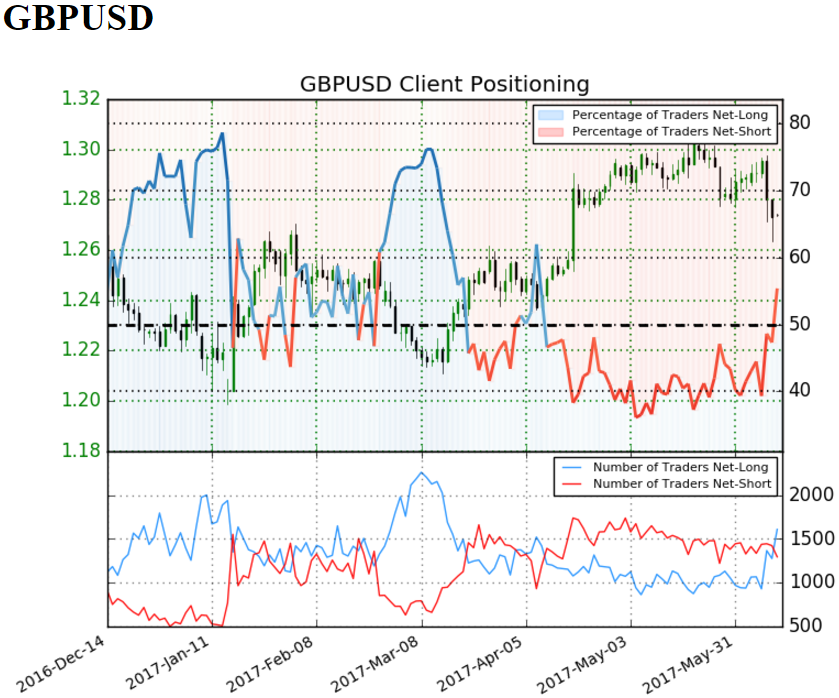
Retail trader data shows 55.4% of traders are net-long GBP/USD with the ratio of traders long to short at 1.24 to 1. The percentage of traders net-long is now its highest since March 31 when GBP/USD traded near 1.25494. The number of traders net-long is 17.4% higher than yesterday and 53.8% higher from last week, while the number of traders net-short is 14.4% lower than yesterday and 13.1% lower from last week.For More Information on Retail Sentiment, Check Out the New Gauge Developed by DailyFX Based on Trader Positioning
--- Written by David Song, Currency Analyst
To contact David, e-mail dsong@dailyfx.com. Follow me on Twitter at @DavidJSong.
To be added to David's e-mail distribution list, please follow this link.


