


Silver Price Talking Points:
- While the gold price breakout has received the bulk of attention in recent weeks, traders may want to pay more attention to silver prices moving forward; the gold/silver ratio has started to reverse.
- An environment defined by plummeting US Treasury yields and a weak US Dollar has historically been very bullish for silver prices.
- The silver price breakout of the recent consolidation since July 18 sets up an immediate near-term target of 17.358.
Looking for longer-term forecasts on Gold and Silver prices? Check out the DailyFX Trading Guides.
Global financial markets are on fire as a deepening of the US-China trade war seems all but inevitable. The shift away from higher yielding, high beta assets into safe havens has been readily apparent, but perhaps not place more obvious than in price action in US Treasury yields. The US Treasury 10-year yield has slumped to a fresh yearly low in quick order as the prospect of an aggressive Federal Reserve rate cut cycle has gained traction.
US TREASURY 10-YEAR YIELD: DAILY TIMEFRAME (June 2016 to

The decline in US Treasury yields is cultivating an environment that is long-term bullish for precious metals – not just gold prices which have been in the spotlight recently, but silver prices too.
Unlike other commodities, rather than consumption playing the primary driver for gold and silver prices, saving and disposal are the central factors. By ‘saving and disposal’ we mean reasons like: as a hedge against inflation; a safe haven during times of market duress and geopolitical stress; or as an alternative to fiat currencies during periods of low or negative interest rates. Currently, all of these factors are in play.
Interest Rates Play a Dominant Factor in Silver’s Appeal
Real yields are inflation-adjusted yields: in this case, the US Treasury 10-year yield minus the headline inflation rate. Why does this matter? Investing is all about asset allocation and risk-adjusted returns. On the asset allocation side, it’s about achieving required returns given the investor’s wants and needs.
If inflation expectations are rapidly increasing, you would expect to see fixed income underperform: the returns are fixed, after all. Why would you want to have a fixed return when prices are increasing? On a real basis, your returns would be lower than otherwise intended.
For example, let’s say the US Treasury 10-year yield is currently 2.5% and headline inflation is 2%. The nominal interest rate is 2.5%, and the real interest rate is 0.5%. Then all of the sudden if the US Treasury 10-year yielddrops to 1.6% while inflation holds steady, the real interest rate would move to -0.4%.
Falling US real yields means that the spread between Treasury yields and inflation rates are decreasing. If precious metals yield nothing (no dividends, coupons, or cash flows), they would best suited to rally when US real yields fell.
That is: silver’s appeal as an inflation hedge relative to the US Dollar increases not in an environment when inflation is just rising, but when inflation is rising and nominal interest rates are not rising at the same pace; or in sum when US real yields are dropping. With the US-China trade war raging – tariffs increasing input costs as the Fed cuts rates – US real yields are set on a downward path at present time.
Consider How Gold and Silver Have Performed Over the Years
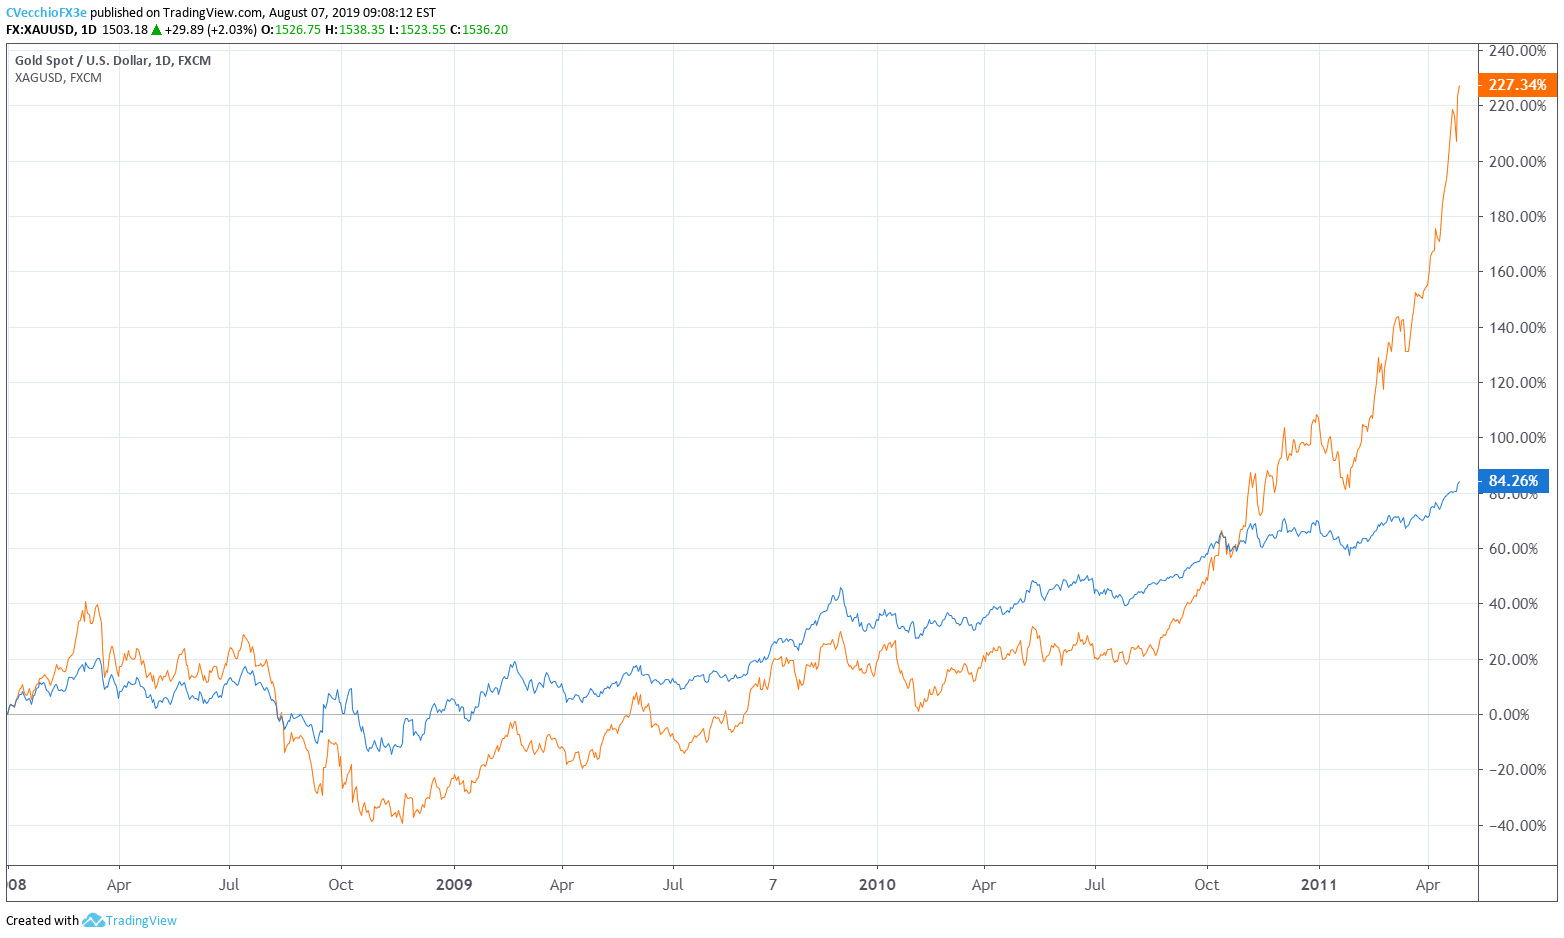
An environment defined by plummeting US Treasury yields and a weak US Dollar has historically been very bullish for silver prices. Consider how silver prices (orange line) outperformed gold prices (blue line) during the height of the Global Financial Crisis:
GOLD VERSUS SILVER PRICES: DAILY TIMEFRAME (January 2006 to September 2011) (Chart 2)
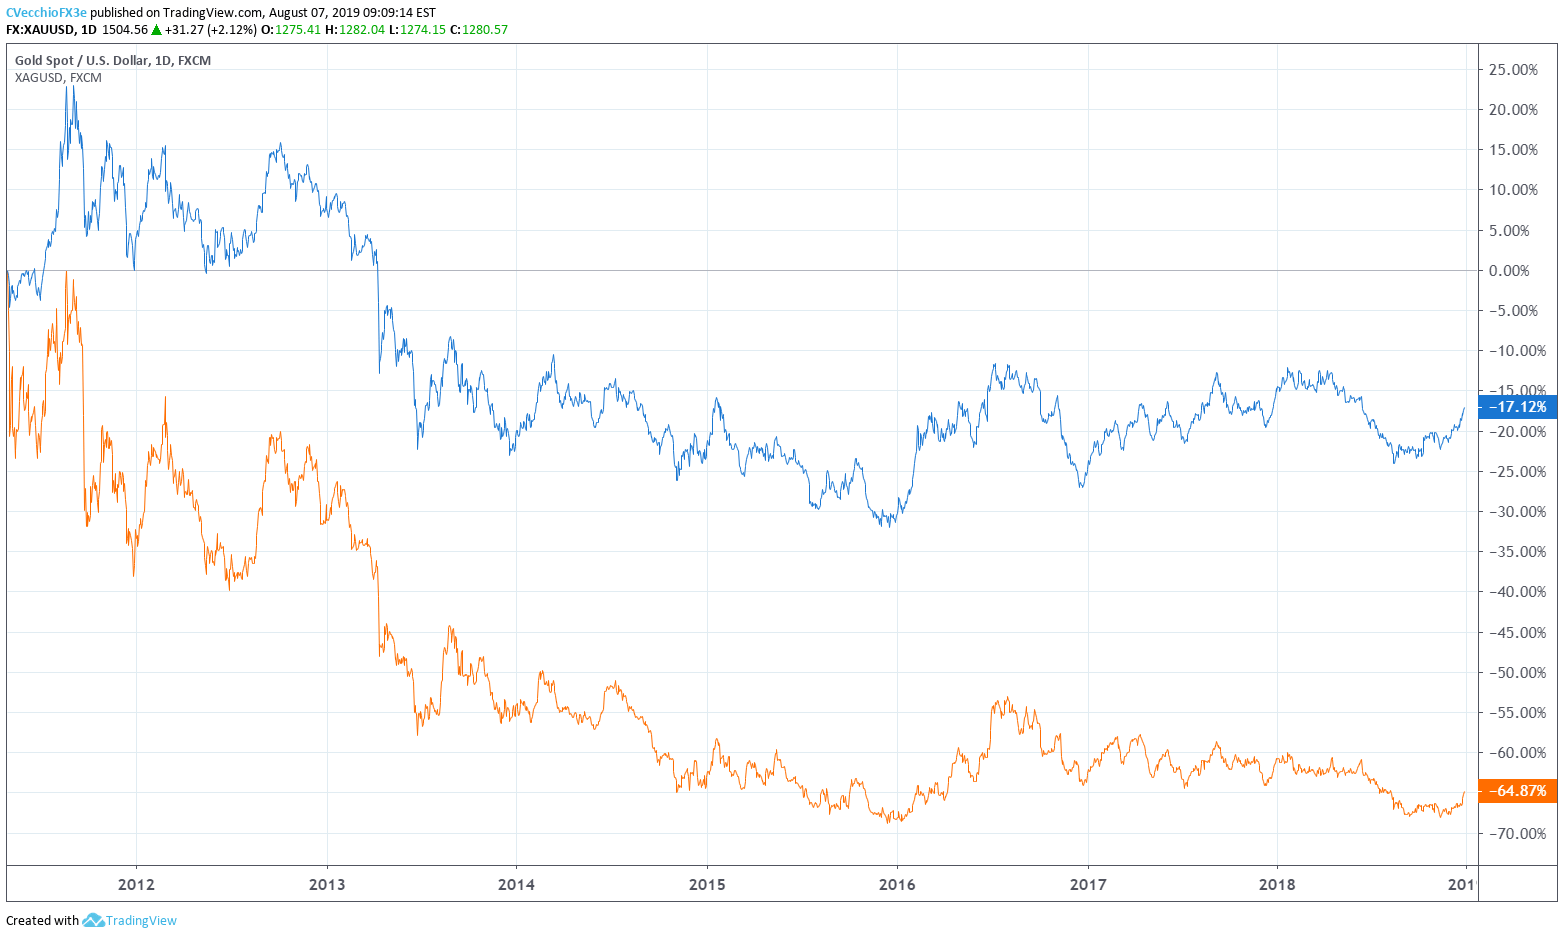
And then how silver prices underperformed relative to gold prices in the years thereafter:
GOLD VERUS SILVER PRICES: DAILY TIMEFRAME (September 2011 to December 2018) (Chart 3)
Thus far, in 2019, gold prices have indeed continued to outpace silver prices to the topside:
GOLD VERUS SILVER PRICES: DAILY TIMEFRAME (January 2019 to August 2019) (Chart 4)

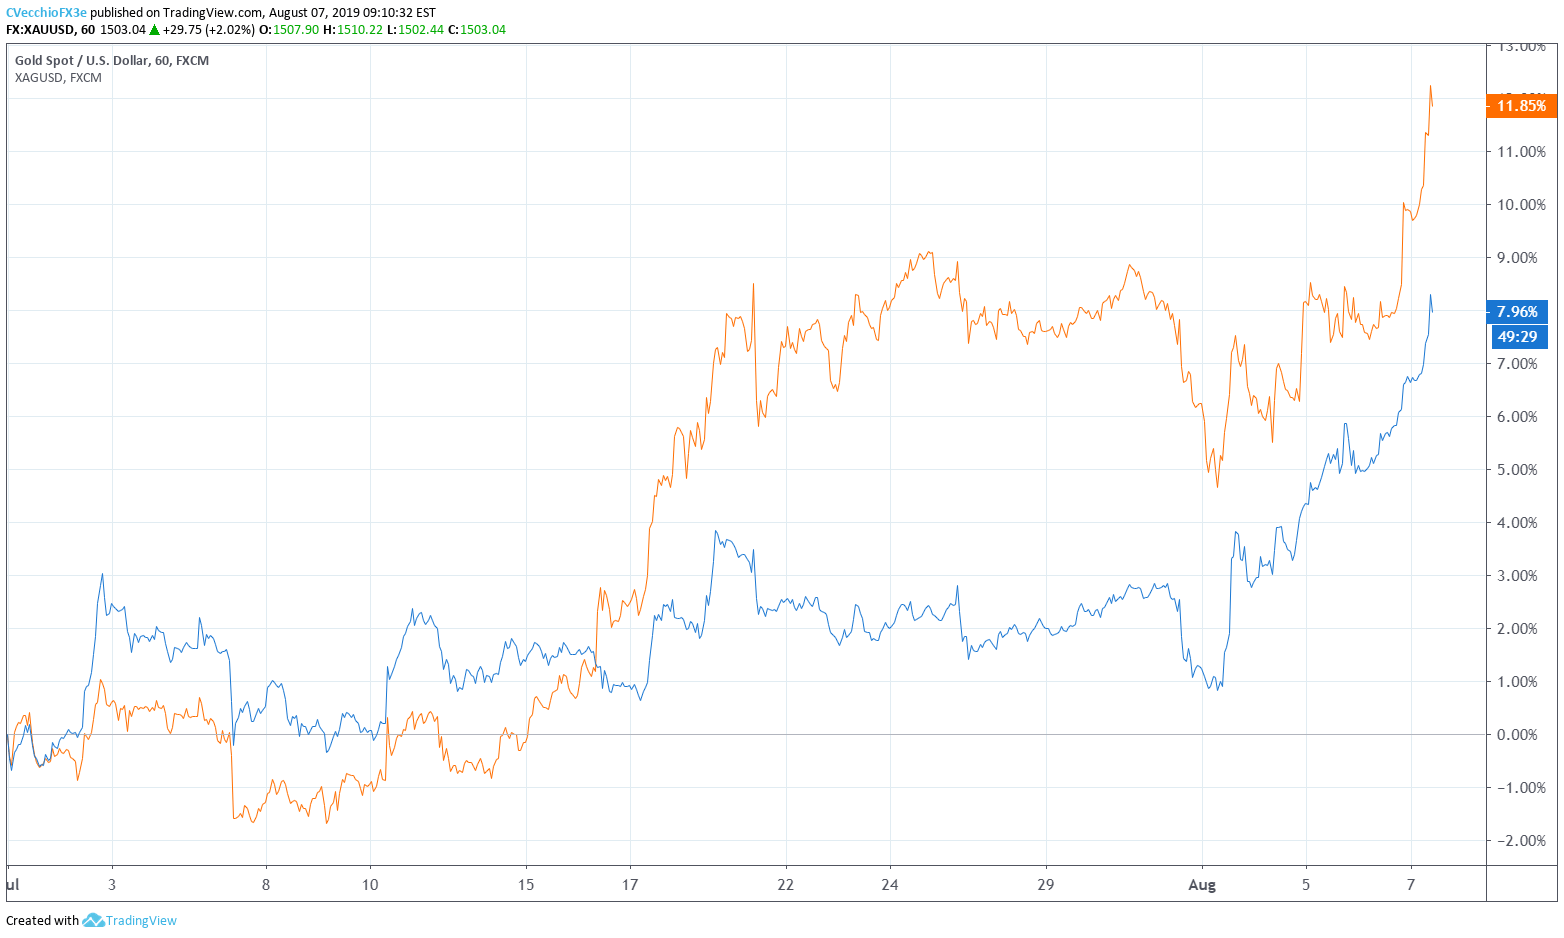
But as the US-China trade war has come back into focus in recent weeks, the relationship has started to change; silver prices have started to outpace gold prices back to the topside since the start of July:
GOLD VERUS SILVER PRICES: HOURLY TIMEFRAME (July 2019 to August 2019) (Chart 5)
As a result, there has been a sharp downswing in the gold/silver ratio, which itself has been on a steady incline since the precious metals peaked during the depths of the debt crisis of 2011:
GOLD/SILVER RATIO: DAILY TIMEFRAME (DECEMBER 2010 to August 2019) (Chart 6)
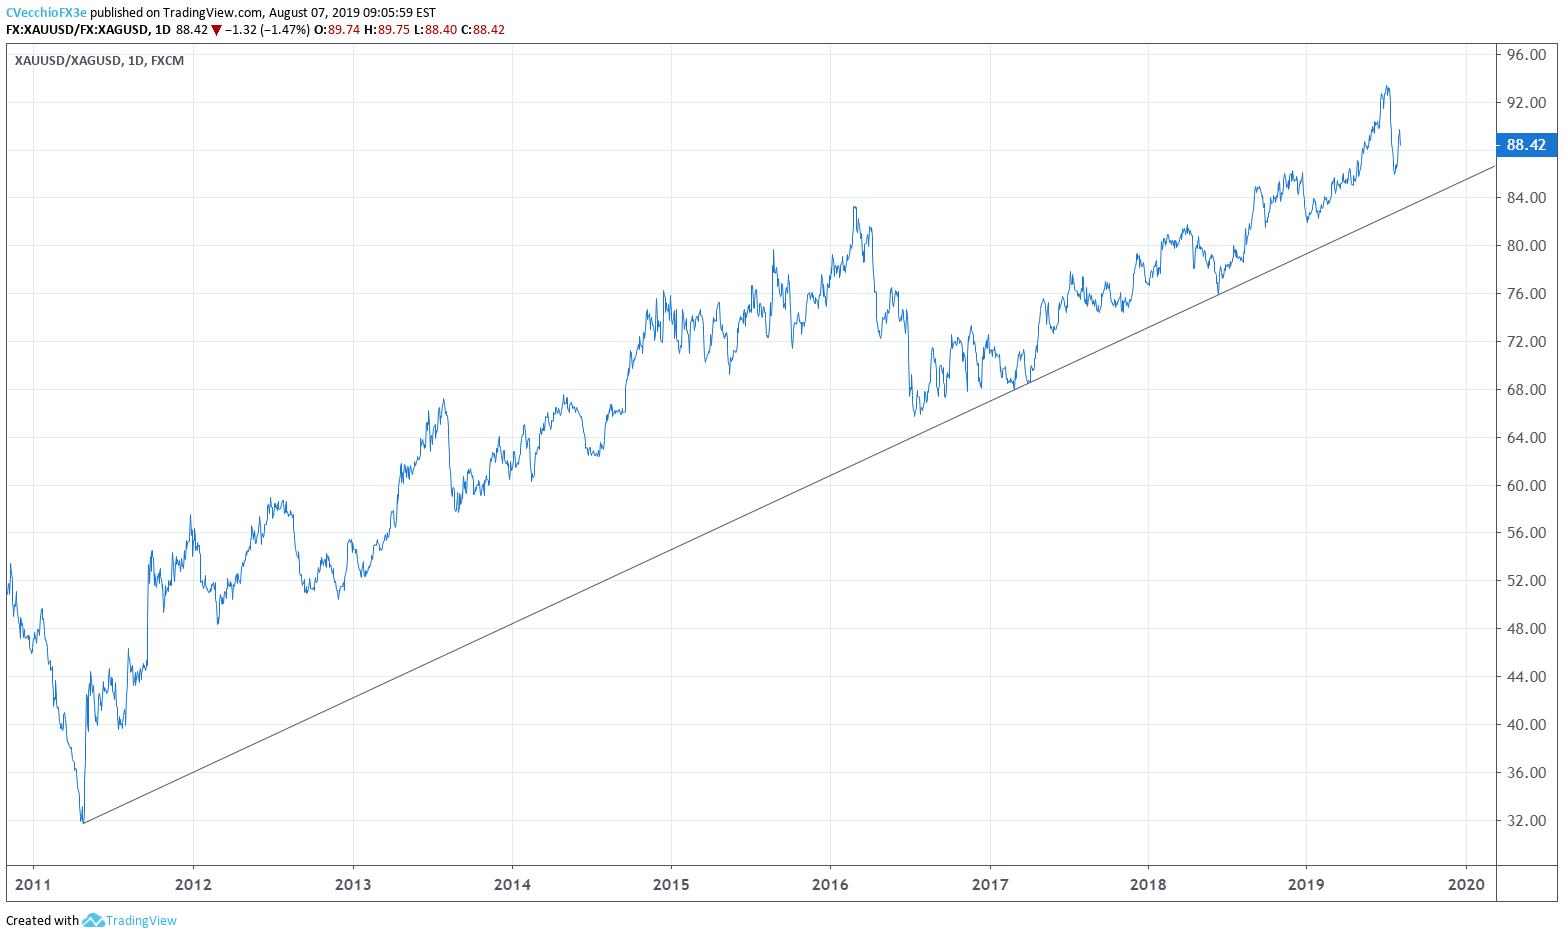
It’s too soon to make such a call, but a further pullback in the gold/silver ratio and an eventual break of the uptrend dating back to the 2011 lows. Such a development would only reinforce what is quickly becoming a more bullish environment for silver prices.
Read more: Trading the Gold-Silver Ratio: Strategies & Tips
Now, technical developments are beginning to suggest similarly bullish outcomes for silver prices:
SILVER PRICE TECHNICAL ANALYSIS: WEEKLY CHART (AUGUST 2013 TO AUGUST 2019) (CHART 7)
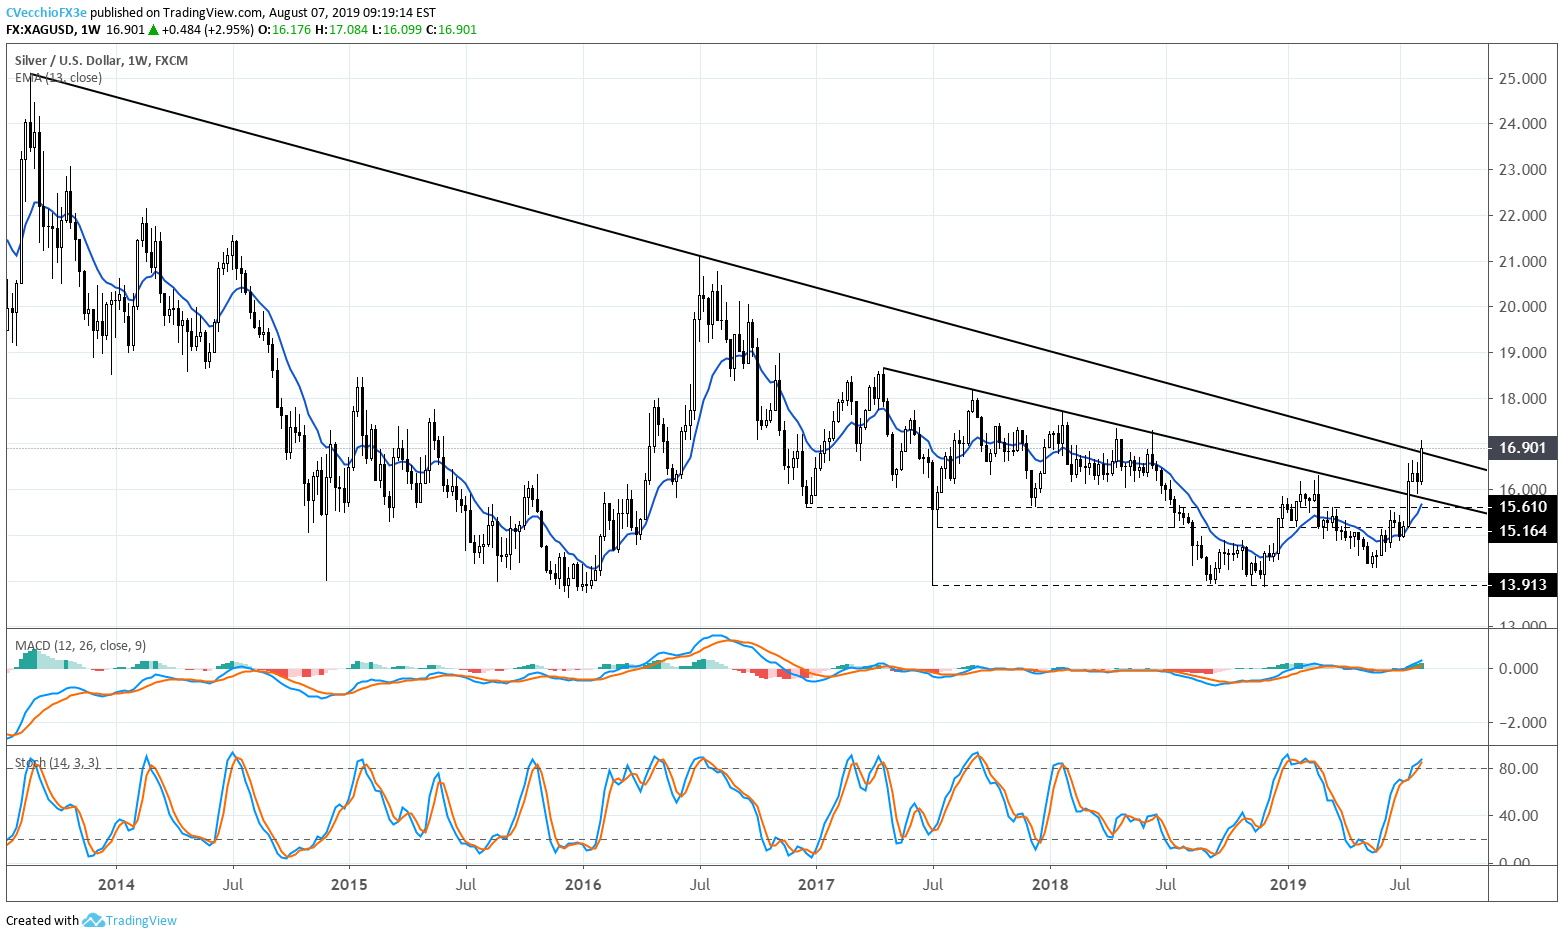
Silver prices have started to make a number of key technical breaks to the topside. The key break transpiring this week would constitute a move through the descending trendline from the 2013 and 2016 swing highs, with resistance coming in near 16.70; silver was trading at 16.901 at the time this note was written.
SILVER PRICE TECHNICAL ANALYSIS: DAILY CHART (DECEMBER 2017 TO AUGUST 2019) (CHART 8)

The break of the downtrend from the 2013 and 2016 swing highs is coming after a number of other key breaks as well. The downtrend from the April and September 2017 and February and June 2018 highs was broken in mid-July, but since July 18, silver prices had been trapped in a sideways range between 15.904 and 16.631.
But price action this week has now provoked a breakout of the sideways range, and the measured move higher outside of the consolidation calls for silver prices to climb to 17.358 in the near-term. Such an advance would see silver prices run back into the highs from April and June 2018 near 17.337.
With silver prices above their daily 8-, 13-, and 21-EMA, and both daily MACD and Slow Stochastics pointing higher again in bullish or overbought territory, the path of least resistance is higher at present time.
FX TRADING RESOURCES
Whether you are a new or experienced trader, DailyFX has multiple resources available to help you: an indicator for monitoring trader sentiment; quarterly trading forecasts; analytical and educational webinars held daily; trading guides to help you improve trading performance, and even one for those who are new to FX trading.
--- Written by Christopher Vecchio, CFA, Senior Currency Strategist
To contact Christopher Vecchio, e-mail at cvecchio@dailyfx.com
Follow him on Twitter at @CVecchioFX
View our long-term forecasts with the DailyFX Trading Guides


