


Gold Price Talking Points:
- Gold prices moved up to another fresh 2019 high today, hitting a key Fibonacci extension in the process. In turn, more consolidation may be due ahead of the July Fed meeting.
- The whipsaw in gold volatility, as measured by the Cboe’s ETF, GVZ (which tracks the 1-month implied volatility of gold as derived from the GLD ETF option chain) can be directly tied to the haywire shifts in Fed rate cut expectations.
- Retail trader positioning suggests that the gold price rally may be set to resume.
Looking for longer-term forecasts on Gold and Silver prices? Check out the DailyFX Trading Guides.
Earlier this week, in our gold price forecast on Monday, it was suggested that “stability in the face of adversity – an improved environment for risk appetite – bodes well for gold’s future prospects.” Indeed, after consolidating for the past three-weeks, gold prices were able to climb to fresh 2019 highs alongside gold volatility surging as well. The catalyst? Look no further than shifting Fed rate cut odds.
Fed Rate Cut Swing Violently
It’s understood by market participants that both Fed funds futures and Eurodollar contracts are suggesting that the Federal Reserve will begin an aggressive interest rate cut cycle at the July Fed meeting. There is little doubt that these developments that have undergirded the most significant factor in the gold price rally since the end of May.
For both Fed funds and for Eurodollars, rate expectations have swung around 10-bps from high to low this week, rather sharp moves in such a short-period of time. Overall, Fed funds are pricing in exactly a 50% chance of 75-bps of rate cuts in 2019.
In turn, with short-term US Treasury yields biased lower over the past several months, the ongoing erosion in US real yields continues to serve as a fundamentally bullish backdrop for gold prices (even if prices pullback in the near-term after achieving a key Fibonacci extension level).
Gold Volatility Edges Up Alongside Rate Cut Odd Volatility
Gold volatility (as measured by the Cboe’s gold volatility ETF, GVZ, which tracks the 1-month implied volatility of gold as derived from the GLD option chain) set a fresh yearly high set yesterday at 17.45, but has since eased back to 15.64. Earlier this week we suggested that “it stands to reason that a base is forming for higher gold prices” (more on the gold price rally to fresh all-time highs in the gold technical analysis review below). Much of these movements are tied to swings in Fed rate cut odds, which went haywire over the past 24-hours, sending the US Dollar into a whipsaw.
GVZ (Gold Volatility) Technical Analysis: Daily Price Chart (October 2016 to July 2019) (Chart 1)
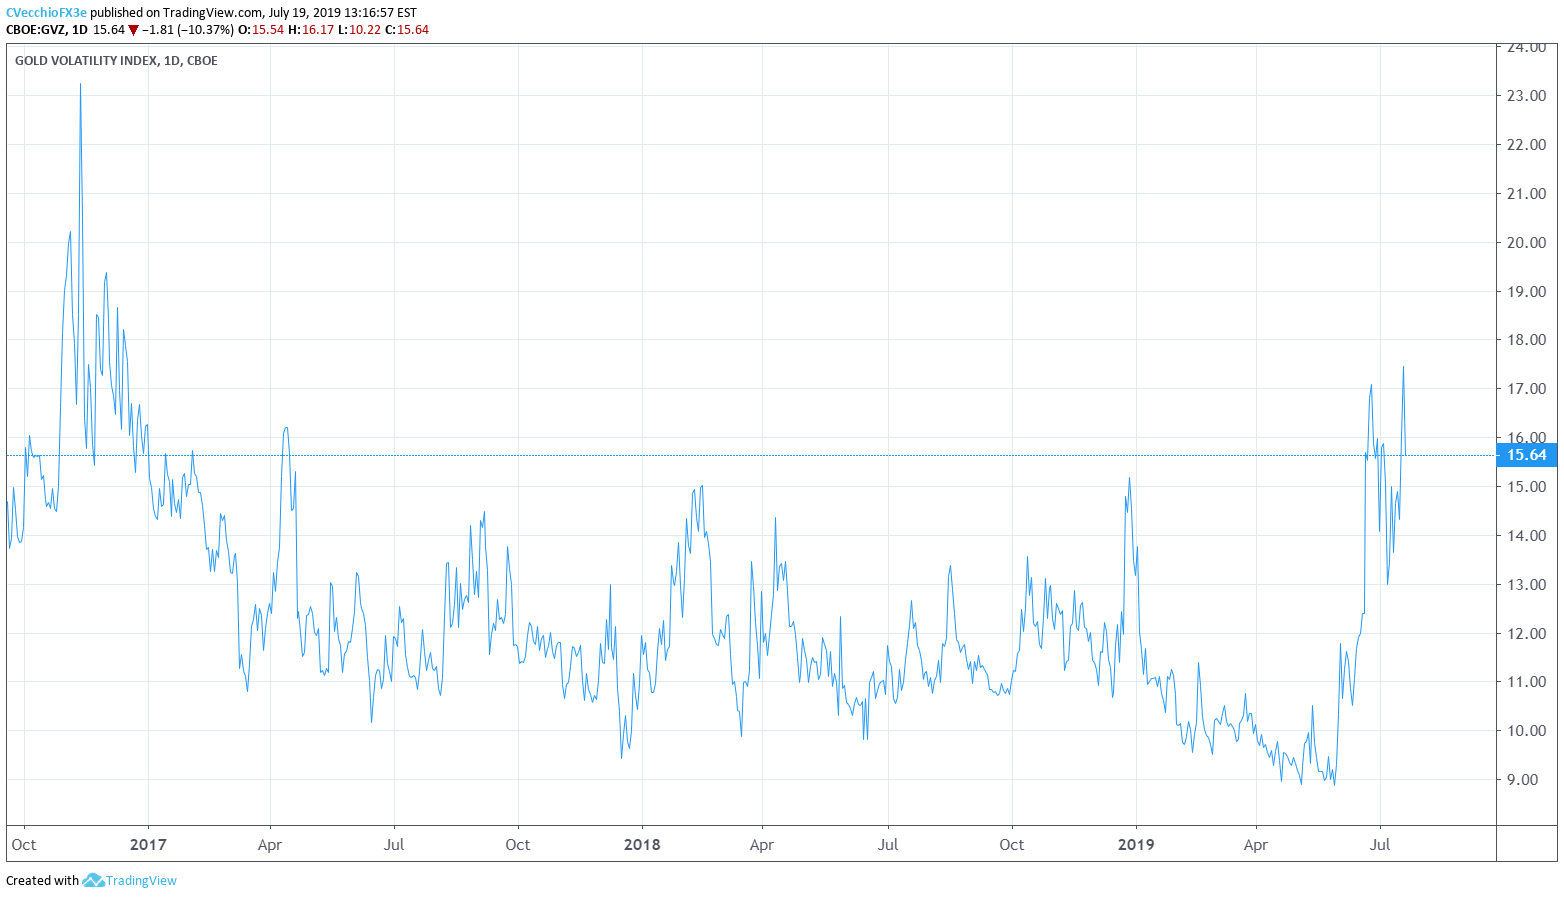
As a measure of uncertainty, gold volatility’s recent moves in July can be traced back to the uncertainty created by the US-China trade war and the resulting impact on Fed interest rates. While other asset classes don’t like increased volatility (signaling greater uncertainty around cash flows, dividends, coupon payments, etc.), precious metals tend to benefit from periods of higher volatility as uncertainty increases the appeal of gold’s and silver’s safe haven appeal.
Gold Price Technical Analysis: Daily Chart (July 2018 to July 2019) (Chart 2)
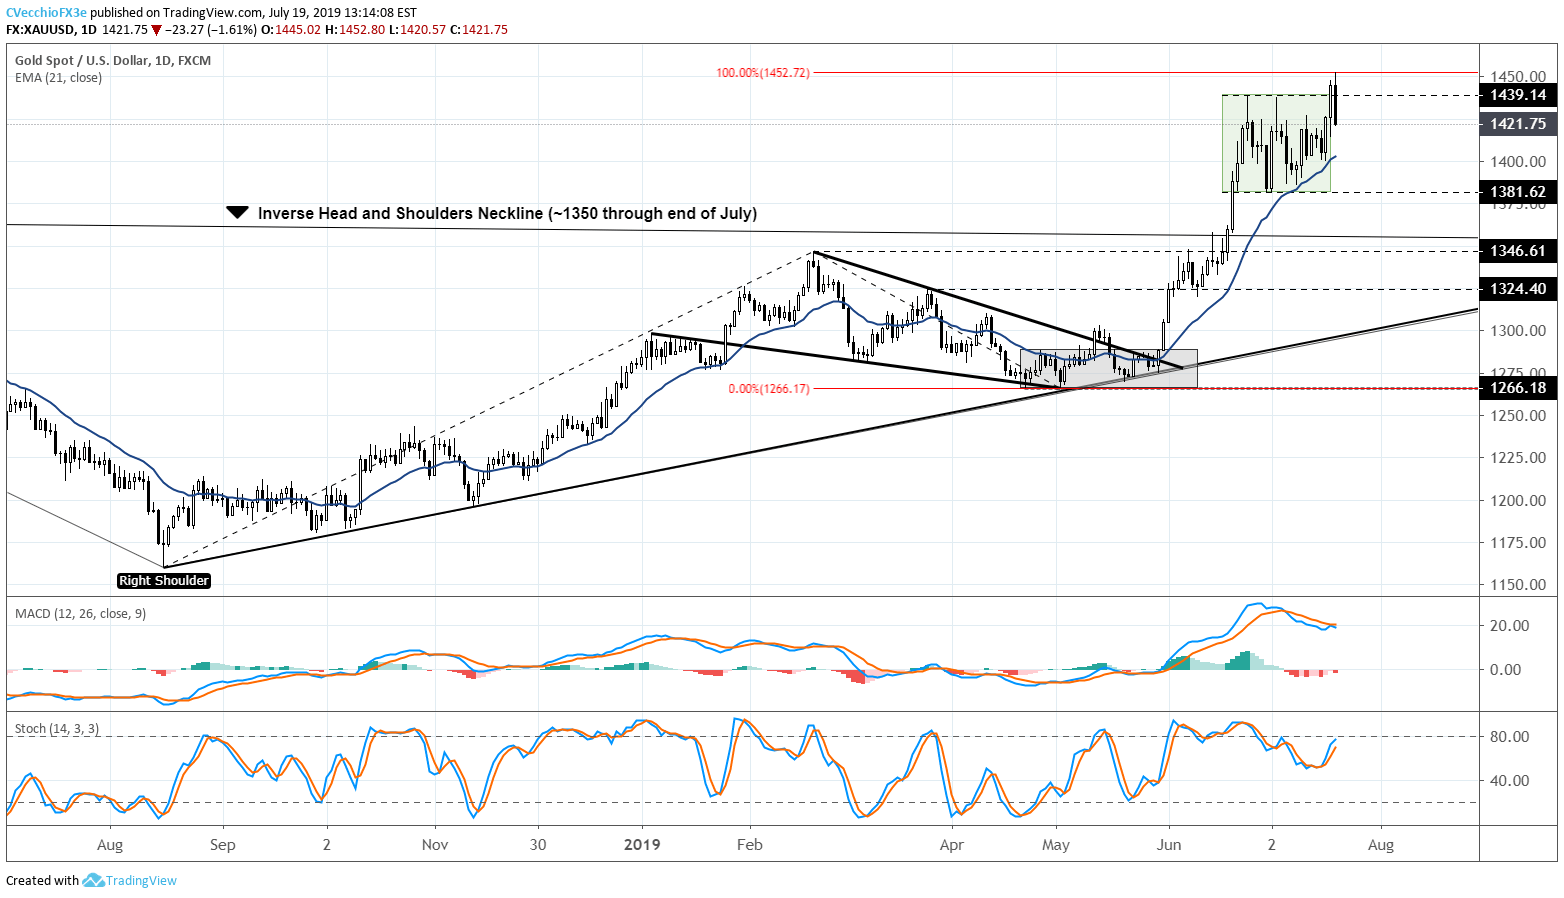
In the June 24 research note, “Gold Price Hits Another 2019 High - Setup for Long-term Rally by XAU/USD,” long-term bullish targets were outlined for gold prices. The first key level outlined was 1452.72, the 100% Fibonacci extension of the gold price rally from the August 2018 low, February 2019 high, and May 2019 low – that level was achieved today with gold prices hitting a fresh 2019 high at 1452.80.
As a result of the 100% Fibonacci extension at 1452.72 being achieved, there now stands reason to think that a round of profit taking is possible. Reinforcing this belief that a short-term period of consolidation could emerge is the fact that the pullback in gold prices today saw a return back into the 1381.62-1439.14 sideways range that was in place since the June Fed meeting.
To this end, unless gold prices lose the daily 21-EMA, a moving average that hasn’t been closed below since the bullish outside engulfing bar/key reversal on May 30, then there is still good reason to believe that the long-term bullish forecast (vis-à-vis the bullish inverse head and shoulder’s pattern) remains valid.
IG Client Sentiment Index: Spot Gold Price Forecast (July 19, 2019) (Chart 3)
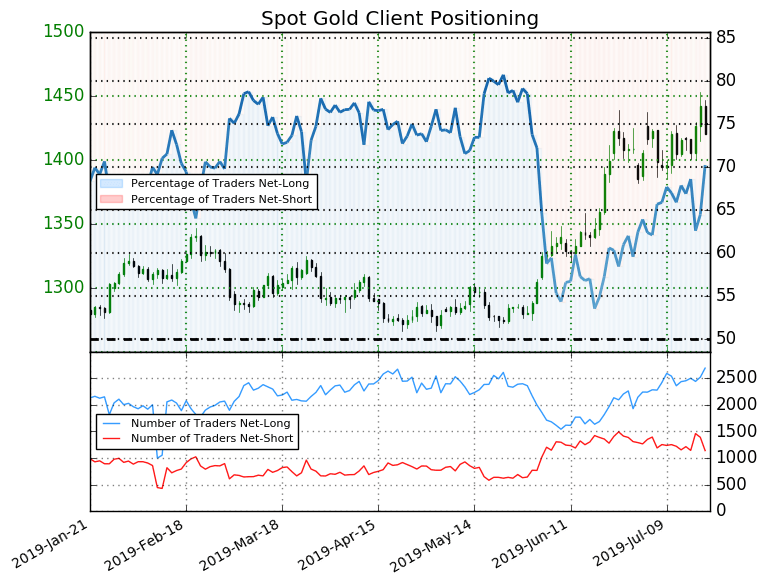
Spot gold: Retail trader data shows 70.2% of traders are net-long with the ratio of traders long to short at 2.36 to 1. The percentage of traders net-long is now its highest since May 28 when it traded near 1279.29. The number of traders net-long is 4.6% higher than yesterday and 5.7% higher from last week, while the number of traders net-short is 17.5% lower than yesterday and 8.7% lower from last week.
We typically take a contrarian view to crowd sentiment, and the fact traders are net-long suggests spot gold prices may continue to fall. Traders are further net-long than yesterday and last week, and the combination of current sentiment and recent changes gives us a stronger spot gold-bearish contrarian trading bias.
FX TRADING RESOURCES
Whether you are a new or experienced trader, DailyFX has multiple resources available to help you: an indicator for monitoring trader sentiment; quarterly trading forecasts; analytical and educational webinars held daily; trading guides to help you improve trading performance, and even one for those who are new to FX trading.
--- Written by Christopher Vecchio, CFA, Senior Currency Strategist
To contact Christopher Vecchio, e-mail at cvecchio@dailyfx.com
Follow him on Twitter at @CVecchioFX
View our long-term forecasts with the DailyFX Trading Guides


