


Crude Oil Price Talking Points:
- Crude Oil prices have pulled back after the weekly energy inventory reports, which showed supplies growing faster than expected amid rising tensions between the US and Iran.
- Pullback in oil prices is helping USDCAD hold support and maintain its sideways range dating back to April 23.
- Recent changes in trader positioning suggest that a range break can’t be ruled out for USDCAD in the near-term.
Looking for longer-term forecasts on Oil prices? Check out the DailyFX Trading Guides.
Crude oil prices have taken a sharp turn lower midweek after the US Department of Energy inventory figures for the week ended May 17 showed a larger than expected build in supplies. According to the DOE weekly report, crude oil inventories jumped by 4740K barrels versus an expected decline of -1283K. Similarly, gasoline inventories, on the eve of the summer holiday driving season in the US, rose by 3716K barrels versus an expected decline of -850K.
The surprising rise in energy inventories comes as geopolitical tensions between the US and Iran have ratcheted higher in recent weeks. Just last week reports emerged that Iran-linked military forces attacked US-based Saudi Arabian oil tankers in the Strait of Hormuz – a chokepoint for the energy industry, as 20% of global oil production passes through the waters between the Gulf of Oman and the Persian Gulf.
Now that crude oil prices have pulled back to a fresh weekly low at 61.05, it’s worth taking a step back and examining longer-term charts, as there are potential implications for oil-sensitive currencies like the Canadian Dollar.
Crude Oil Technical Analysis: Weekly Price Chart (April 2018 to May 2019) (Chart 1)
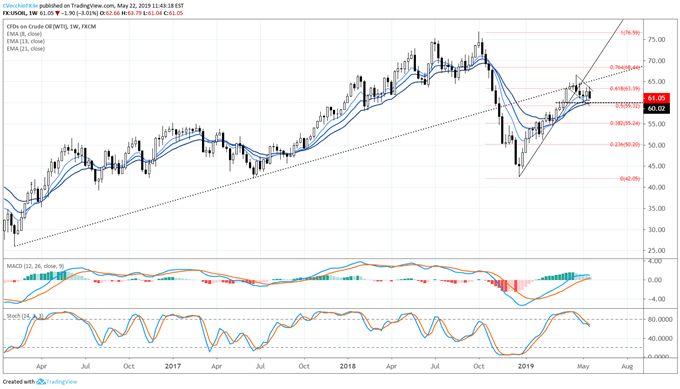
Traders watching long-term crude oil price charts will take notice of a bearish piercing candle forming on the weekly timeframe; should we see a close below 60.63 on Friday, then we would have a bearish outside engulfing bar in place. Regardless of either a bearish piercing candle or a bearish outside engulfing bar, momentum is starting to shift to the downside.
Crude Oil Technical Analysis: Daily Price Chart (April 2018 to May 2019) (Chart 2)
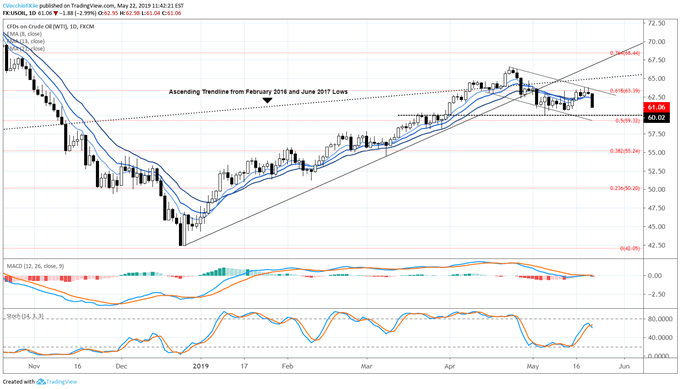
The daily crude oil price chart better highlights the bearish momentum emerging in crude oil prices. With today’s price action, crude oil is now below its daily 8-, 13-, and 21-EMA envelope. Similarly, daily MACD has turned lower below its signal line into bearish territory, while Slow Stochastics have turned lower as well (albeit still above its median line). A return to the May 2019 low at 60.02 should not be ruled out over the coming sessions.
IG Client Sentiment Index: Crude Oil Price Forecast (May 22, 2019) (Chart 3)
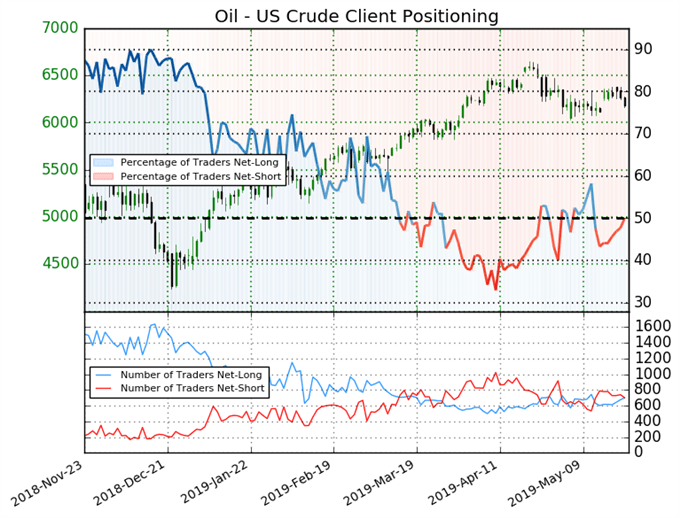
Crude oil: Retail trader data shows 49.9% of traders are net-long with the ratio of traders short to long at 1.0 to 1. The number of traders net-long is 6.2% higher than yesterday and 8.1% lower from last week, while the number of traders net-short is 11.8% lower than yesterday and 4.3% higher from last week.
We typically take a contrarian view to crowd sentiment, and the fact traders are net-short suggests crude oil prices may continue to rise. Positioning is less net-short than yesterday but more net-short from last week. The combination of current sentiment and recent changes gives us a further mixed crude oil trading bias.
USDCAD Technical Analysis: Daily Price Chart (April 2018 to May 2019) (Chart 4)
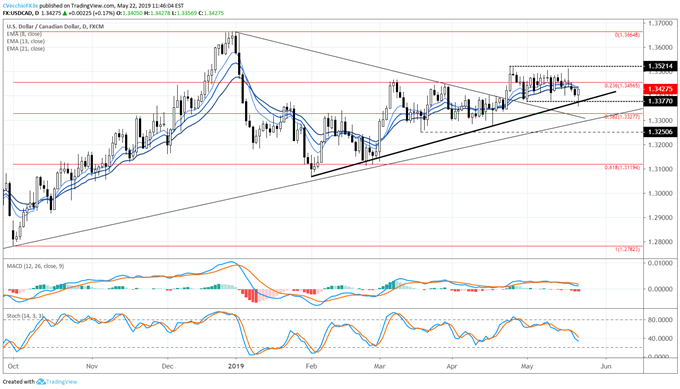
With crude oil prices turning lower, the oil-sensitive Canadian Dollar has come back under pressure, perhaps a sign that the goodwill around the USMCA progress has started to wane. Since the close on April 23, USDCAD prices have closed every session between 1.3377 and 1.3521, and with the daily bullish hammer forming today, the range appears ready to hold its ground. Concurrently, the USDCAD price rebound today has found support at the uptrend from the February, March, and April swing lows.
Should USDCAD move above 1.3521, we would again be looking at topside break of the month-long range, while a drop below 1.3377 would constitute a downside break of the consolidation as well as the uptrend from February, March, and April 2019 swing lows.
IG Client Sentiment Index: USDCAD Price Forecast (May 22, 2019) (Chart 5)
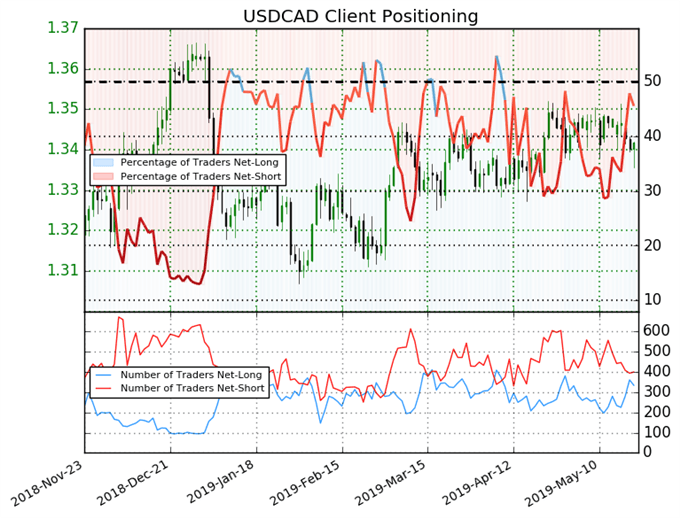
USDCAD: Retail trader data shows 45.5% of traders are net-long with the ratio of traders short to long at 1.2 to 1. The number of traders net-long is 5.7% higher than yesterday and 47.8% higher from last week, while the number of traders net-short is 3.6% lower than yesterday and 33.3% lower from last week.
We typically take a contrarian view to crowd sentiment, and the fact traders are net-short suggests USDCAD prices may continue to rise. Yet traders are less net-short than yesterday and compared with last week. Recent changes in sentiment warn that the current USDCAD price trend may soon reverse lower despite the fact traders remain net-short.
FX TRADING RESOURCES
Whether you are a new or experienced trader, DailyFX has multiple resources available to help you: an indicator for monitoring trader sentiment; quarterly trading forecasts; analytical and educational webinars held daily; trading guides to help you improve trading performance, and even one for those who are new to FX trading.
--- Written by Christopher Vecchio, CFA, Senior Currency Strategist
To contact Christopher Vecchio, e-mail at cvecchio@dailyfx.com
Follow him on Twitter at @CVecchioFX
View our long-term forecasts with the DailyFX Trading Guides


