


- Crude Oil price breakdown approaching initial support hurdles- shorts vulnerable near-term
- Check out our 2019 projections in our Free DailyFX Crude Oil Trading Forecasts
- Join Michael for Live Weekly Strategy Webinars on Mondays at 12:30GMT
Crude Oil Prices are poised to mark a sixth consecutive daily decline today if price closes at these levels with the sell-off now targeting the first major support zone just lower. These are the updated targets and invalidation levels that matter on the crude oil price charts (WTI). Review this week's Strategy Webinar for an in-depth breakdown of this oil price setup and more.
New to Oil Trading? Get started with this Free How to Trade Crude Oil Beginners Guide
Crude Oil Price Chart - WTI Daily
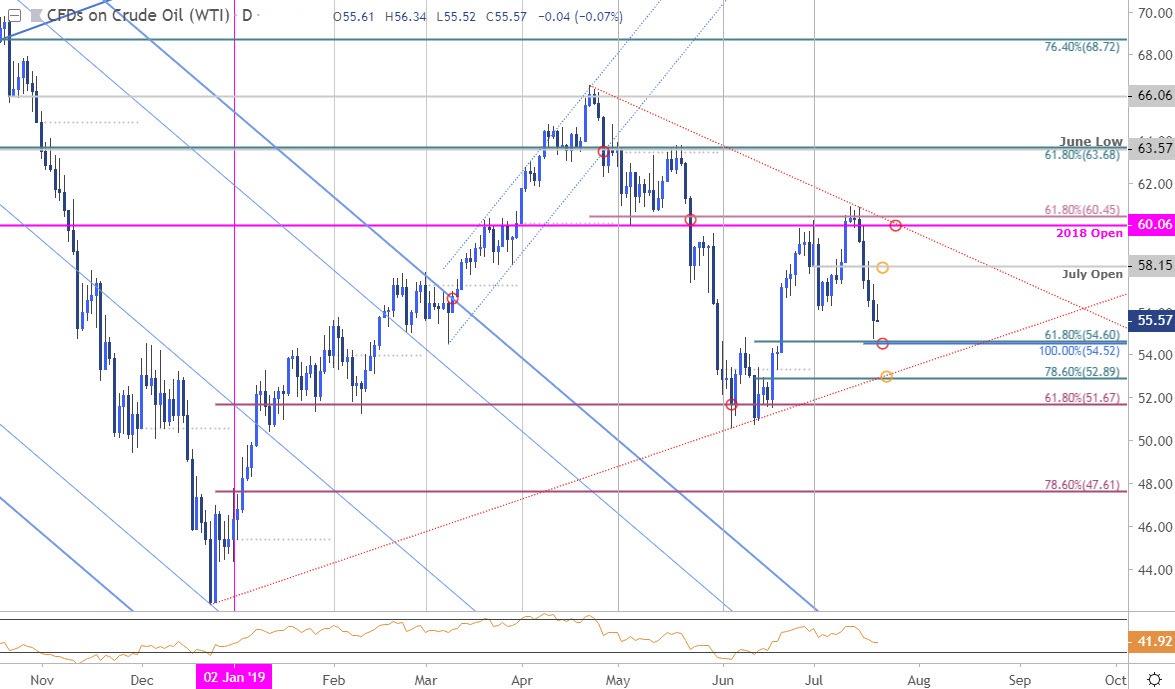
Technical Outlook: In my latest Oil Price Weekly Outlook we noted, “the immediate oil price advance is vulnerable while below confluence resistance at 60.06/47. From a trading standpoint, a good place to reduce long-exposure / raise protective stops. Be on the lookout for possible topside exhaustion to give way to a larger pullback in crude.” The subsequent five-day sell-off has now broken below the monthly open support and the objective July opening-range lows and leaves the risk for further losses heading into the close of the month.
That said, the immediate decline is now approaching initial areas of support which could interrupt the current oil price breakdown. Confluence support rests at 54.52/60 backed by the December trendline / 78.6% retracement at 52.89- both areas of interest for near-term exhaustion.
Why does the average trader lose? Avoid these Mistakes in your trading
Crude Oil Price Chart – WTI 240min
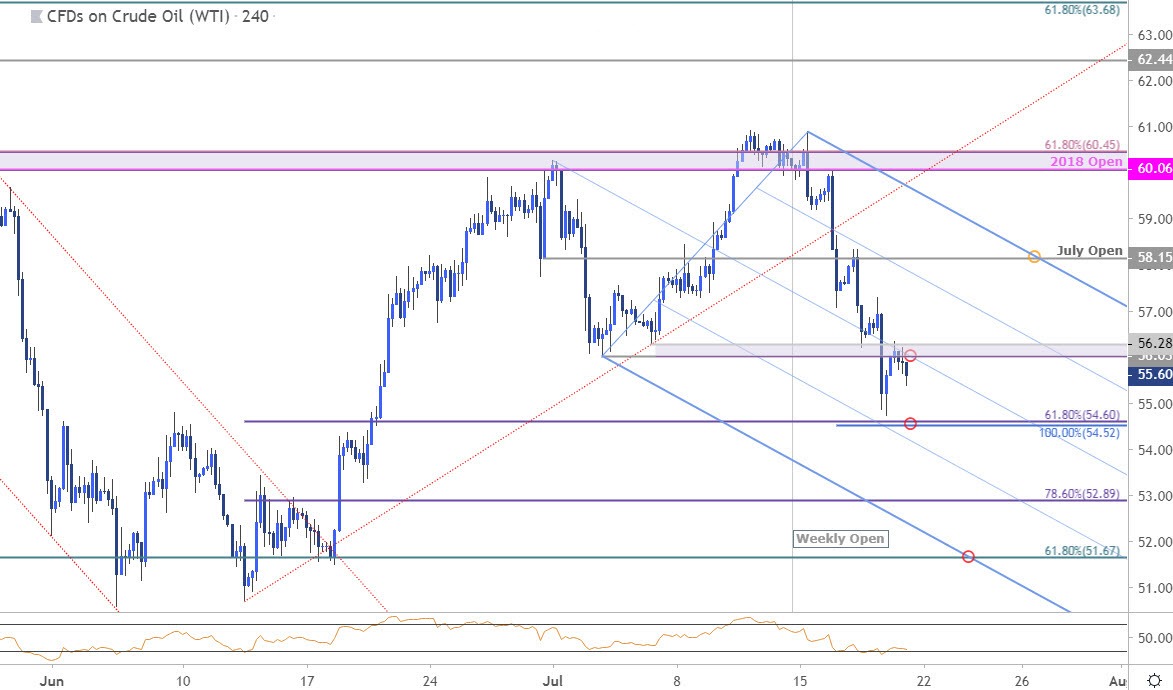
Notes: A closer look at oil price action shows WTI posting a 4-hour outside-reversal bar off key resistance at 60.06/45 early in the week with the decline trading within the confines of a well-defined descendingpitchfork formation. Initial resistance at the median-line / monthly opening-range lows at 56.03/28 with broader bearish invalidation now lowered to the July open at 58.15. A break below the 54.52/60 support zone exposes subsequent downside objectives at 52.89 and 51.67- look for a bigger reaction there IF reached.
Learn how to Trade with Confidence in our Free Trading Guide
Bottom line: The oil price sell-off is approaching the first major support target and while the broader risk remains lower, the immediate decline may be vulnerable heading into 54.52/60. From a trading standpoint, a good spot to reduce short-exposure / lower protective stops – we’ll be on the lookout for possible downside exhaustion on a stretch lower.
For a complete breakdown of Michael’s trading strategy, review his Foundations of Technical Analysis series on Building a Trading Strategy
Crude Oil Trader Sentiment (WTI)
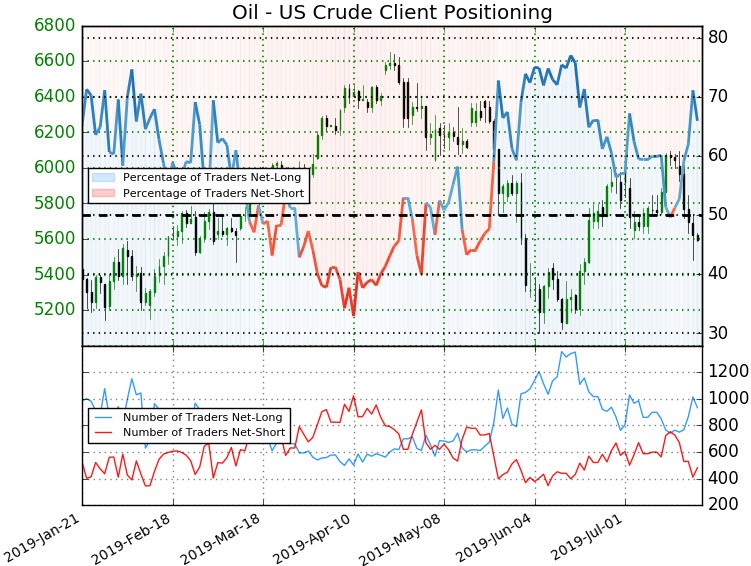
- A summary of IG Client Sentiment shows traders are net-long Crude Oil - the ratio stands at +1.94 (66.0% of traders are long) – bearish reading
- Long positions are 3.5% higher than yesterday and 22.3% higher from last week
- Short positions are 4.6% lower than yesterday and 34.4% lower from last week
- We typically take a contrarian view to crowd sentiment, and the fact traders are net-long suggests Oil prices may continue to fall. Traders are further net-long than yesterday & last week, and the combination of current positioning and recent changes gives us a stronger Oil - US Crude-bearish contrarian trading bias from a sentiment standpoint.
See how shifts in Crude Oil retail positioning are impacting trend- Learn more about sentiment!
---
Active Trade Setups
- Gold Price Chart: XAU/USD Approaching Range Highs– Battle Lines Drawn
- Sterling Price Chart: British Pound Testing Post-Brexit Support
- Canadian Dollar Price Chart: Loonie Drives USD/CAD to Weekly Support
- Aussie Weekly Price Chart: Australian Dollar Testing Key Resistance
- Written by Michael Boutros, Currency Strategist with DailyFX
Follow Michael on Twitter @MBForex


