


- Gold price sell-off testing confluence support- focus is on weekly close around 1275/76
- Check out our 2019 projections in our Free DailyFX Gold Trading Forecasts
- Join Michael for Live Weekly Strategy Webinars on Mondays at 12:30GMT
In this series we scale-back and look at the broader technical picture to gain a bit more perspective on where we are in trend. Gold is virtually unchanged for the week thus far, with price now testing a major technical support zone we’ve been tracking for months. These are the updated targets and invalidation levels that matter on the XAU/USD weekly price chart. Review this week’s Strategy Webinar for an in-depth breakdown of this setup and more.
New to Gold Trading? Get started with this Free How to Trade Gold -Beginners Guide
Gold Weekly Price Chart (XAU/USD)
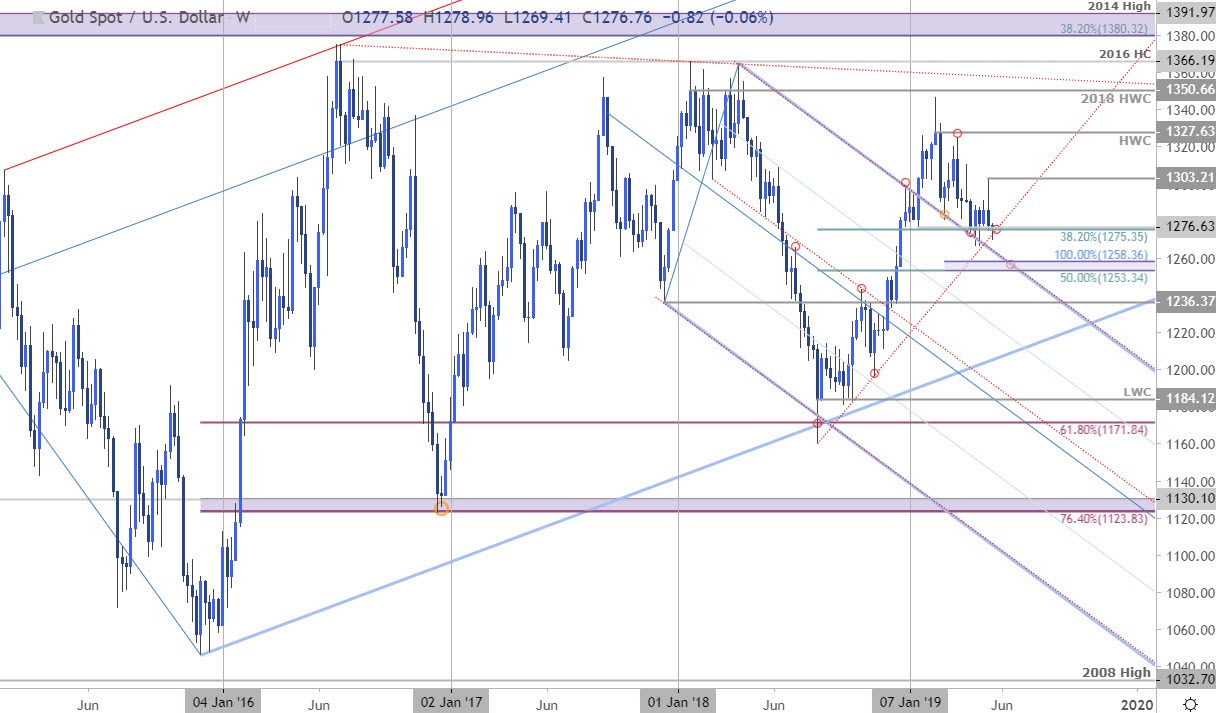
Notes: In my last Gold Price Outlook we warned to be, “on the lookout for downside exhaustion here near-term,” as price was attempting to confirm a weekly close below confluence support at 1275/76- a region defined by the yearly opening-range low and the 38.2% retracement of the 2018 advance. Nearly three-weeks later and price has failed to mark a weekly close below- note that the August trendline also converges on this zone over the next two weeks and we're looking for a resolution.
Gold posted an outside-weekly reversal off fresh monthly highs last week with the sell-off taking gold prices back into this key zone. A weekly close below is still needed to fuel another leg lower targeting more significant support / broader bullish invalidation at 1253/58. Monthly open resistance stands at 1283 backed by the May range high at 1303- a close above would be needed to validate the turn targeting the 2019 high-week close at 1327.
For a complete breakdown of Michael’s trading strategy, review his Foundations of Technical Analysis series on Building a Trading Strategy
Bottom line: The immediate focus is on the weekly close in relation to the 1275/76 zone. From a trading standpoint, a good spot to reduce short-exposure / lower protective stops. A weekly close below would leave the focus on 1253/58- look for a bigger reaction there IF reached. I’ll publish an updated Gold Price Outlook once we get further clarity in near-term price action. Review our latest Gold 2Q forecasts for a longer-term look at the technical picture for XAU/USD prices.
Even the most seasoned traders need a reminder every now and then- Avoid these Mistakes in your trading
Gold Trader Sentiment

- A summary of IG Client Sentiment shows traders are net-long Gold - the ratio stands at +4.32 (81.2% of traders are long) – bearish reading
- The percentage of traders net-long is now its highest since November 25th
- Long positions are 0.2% lower than yesterday and 11.6% higher from last week
- Short positions are 8.8% lower than yesterday and 29.8% lower from last week
- We typically take a contrarian view to crowd sentiment, and the fact traders are net-long suggests Gold prices may continue to fall. Traders are further net-long than yesterday & last week, and the combination of current positioning and recent changes gives us a stronger Gold-bearish contrarian trading bias from a sentiment standpoint.
See how shifts in Gold retail positioning are impacting trend- Learn more about sentiment!
---
Previous Weekly Technical Charts
- Canadian Dollar (USD/CAD)
- Euro (EUR/USD)
- US Dollar (DXY)
- Crude Oil (WTI)
- British Pound (GBP/USD)
- Australian Dollar (AUD/USD)
- New Zealand Dollar (NZD/USD)
Learn how to Trade with Confidence in our Free Trading Guide
--- Written by Michael Boutros, Technical Currency Strategist with DailyFX
Follow Michael on Twitter @MBForex


