


- Updated weekly technicals on US Dollar Index (DXY) – price reversal threatens break of uptrend support
- Check out our 2019 projections in our Free DailyFX USD Trading Forecasts
- Join Michael for Live Weekly Strategy Webinars on Mondays at 12:30GMT
In this series we scale-back and look at the broader technical picture to gain a bit more perspective on where we are in trend. The US Dollar Index turned from slope major resistance into the close of 2018 with the recent sell-off breaking below multi-week range support. Here are the key targets & invalidation levels that matter on the DXY weekly chart. Review this week’s Strategy Webinar for an in-depth breakdown of this setup and more.
New to Forex Trading? Get started with this Free Beginners Guide
DXY Weekly Price Chart
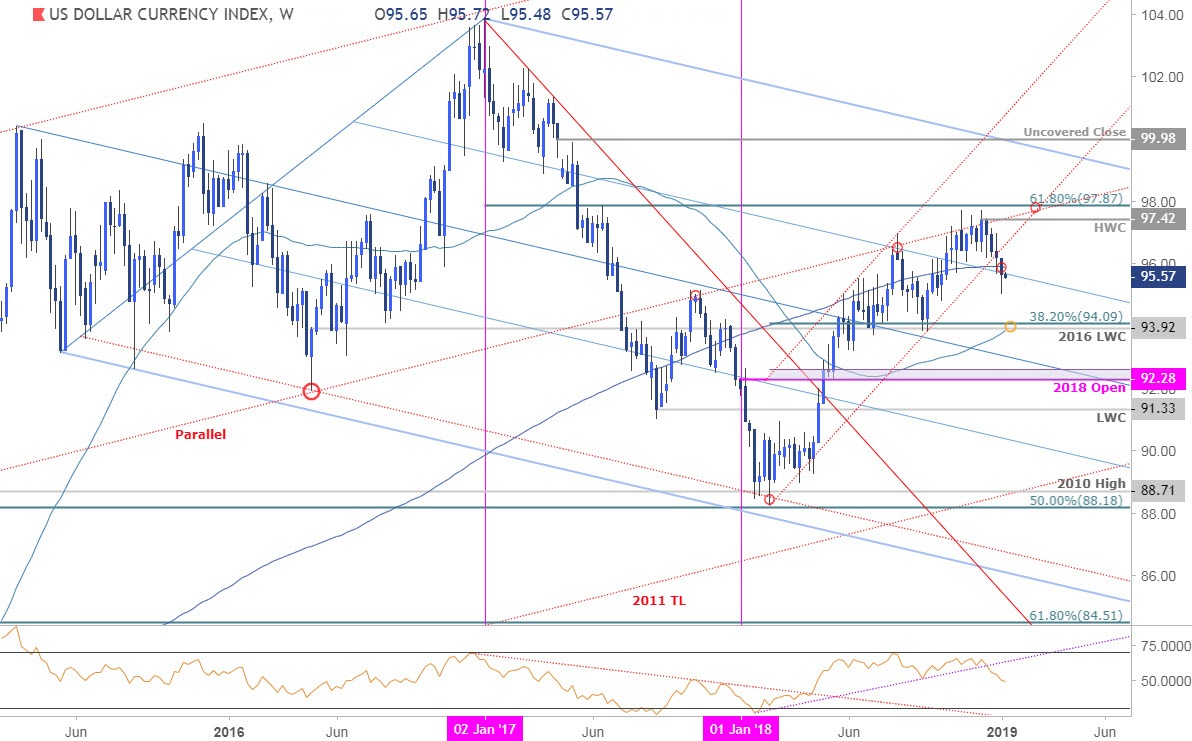
Notes: For months now we’ve been tracking resistance in the US Dollar Index along the parallel of the 2011 trendline (red) with the broader long-bias at risk heading into the 61.8% retracement of the 2017 decline at 97.87. Price held a range below this threshold for nearly nine-weeks before breaking below 2018 channel support early in the year.
A close below the 200-week moving average (currently 95.90s) is needed to keep the immediate focus lower with the next major support objective eyed at 93.88 -94.09- a region defined by the 52-week moving average, the 38.2% retracement of the 2018 range and the 2016 low-week close. Resistance now stands with the high-week close at 97.42 with a breach above 97.87 still needed to fuel the next leg higher in the greenback.
For a complete breakdown of Michael’s trading strategy, review his Foundations of Technical Analysis series on Building a Trading Strategy
Bottom line:The US Dollar Index has turned from a multi-year slope inflection with price now threatening a break of below 2018 uptrend support. IF price is indeed heading lower, advances should be capped by 97.42 with a break lower from here targeting the critical support confluence around the 94-handle. W
Even the most seasoned traders need a reminder every now and then- Avoid these Mistakes in your trading
---
Relevant US Dollar Data Releases
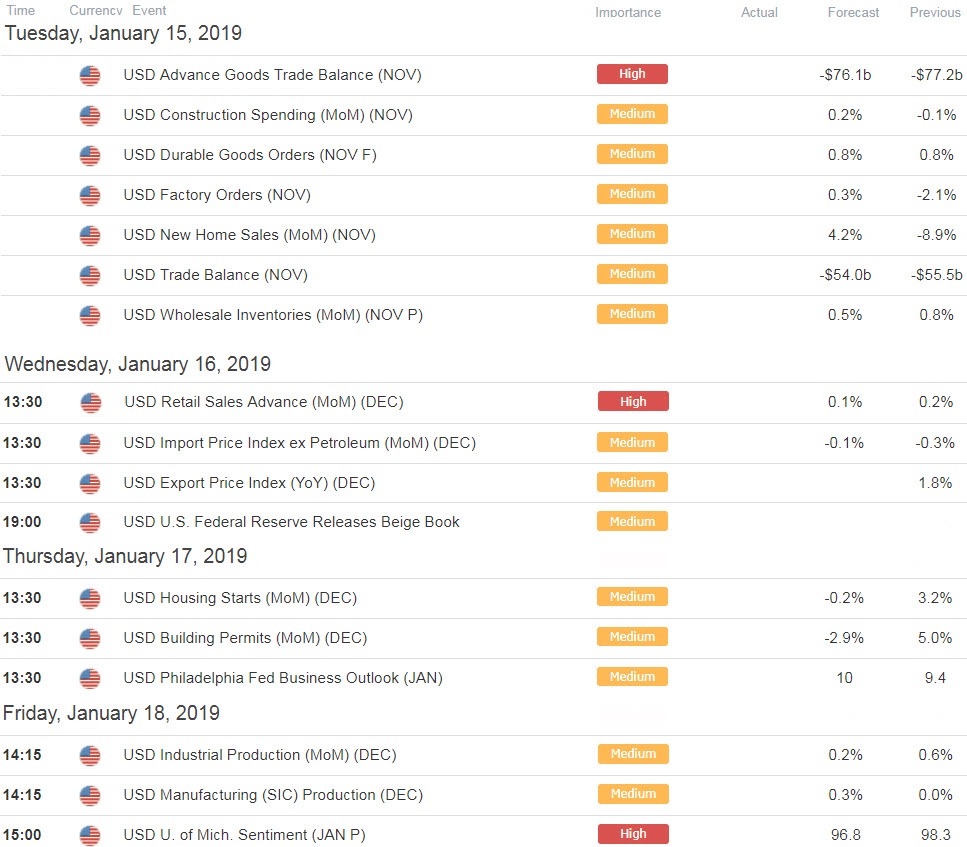
Economic Calendar - latest economic developments and upcoming event risk. Learn more about how we Trade the News in our Free Guide !
Previous Weekly Technical Charts
- Gold (XAU/USD)
- Euro (EUR/USD)
- Australian Dollar (AUD/USD)
- Canadian Dollar (USD/CAD)
- Crude Oil (WTI)
- Japanese Yen (USD/JPY)
Learn how to Trade with Confidence in our Free Trading Guide
--- Written by Michael Boutros, Technical Currency Strategist with DailyFX
Follow Michael on Twitter @MBForex


