


- Updated weekly technicals on AUD/USD- rebound targeting initial resistance hurdles
- Check out our 4Q projections in our Free DailyFX USD Trading Forecasts
- Join Michael for Live Weekly Strategy Webinars on Mondays at 12:30GMT
In this series we scale-back and take a look at the broader technical picture to gain a bit more perspective on where we are in trend. The Australian Dollar is testing yearly slope resistance on the heels of the RBA decision with the US Midterm Election results and the FOMC interest rate decision on tap. Here are the key targets & invalidation levels that matter on the AUD/USD weekly chart. Review this week’s Strategy Webinar for an in-depth breakdown of this setup and more.
New to Forex Trading? Get started with this Free Beginners Guide
AUD/USD Weekly Price Chart
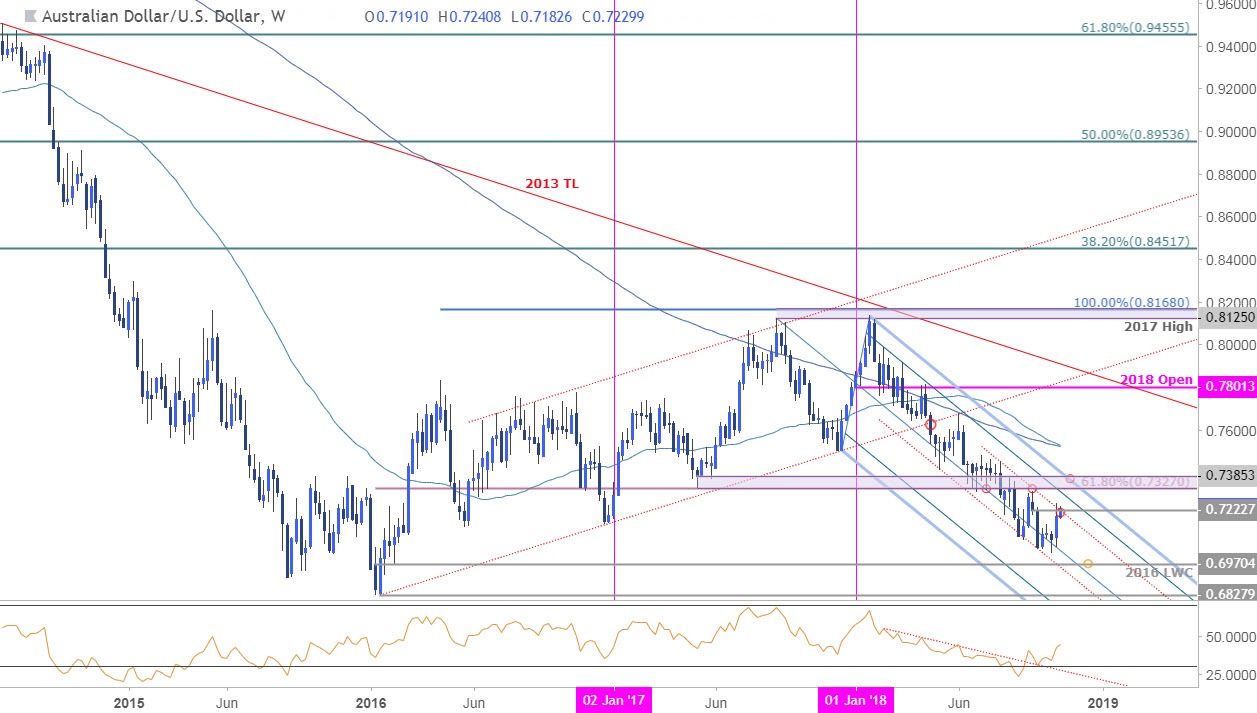
Notes: Aussie has been trading within the confines of a descending pitchfork formation extending off the 2017 & 2018 highs with prices with price rebounding off a sliding parallel (red) extending off the May lows late-last month. The subsequent rebound takes AUD/USD into a parallel that has governed price since the August highs and we’re looking for a reaction here.
Initial resistance stands at the September high-week reversal close at 7223- a topside breach / close above this threshold would look to challenge 7327 where the 75% line of the slope converges on the 61.8% retracement of the 2016 advance. Ultimately a breach above the May low-week close at 7385 would be needed to suggest a more significant low is in place. Interim support rests at the median-line with a break below the 2016 low-week close at 6970 needed to mark resumption of the broader down trend, targeting the 2016 lows at 6828.
For a complete breakdown of Michael’s trading strategy, review his Foundations of Technical Analysis series on Building a Trading Strategy
Bottom line:AUD/USD is testing weekly down-slope resistance here on the heels of the RBA. The immediate advance is vulnerable below this threshold but IF Aussie has turned, losses should be limited to the yearly low-week close at 7087. From a trading standpoint, I’ll favor fading weakness while above this threshold with a breach of the parallel (red) needed to fuel the next leg high in the Australian Dollar. I’ll publish an updated AUD/USD Scalp Report once we get further clarity on near-term price action.
Even the most seasoned traders need a reminder every now and then- Avoid these Mistakes in your trading
AUD/USD Trader Sentiment
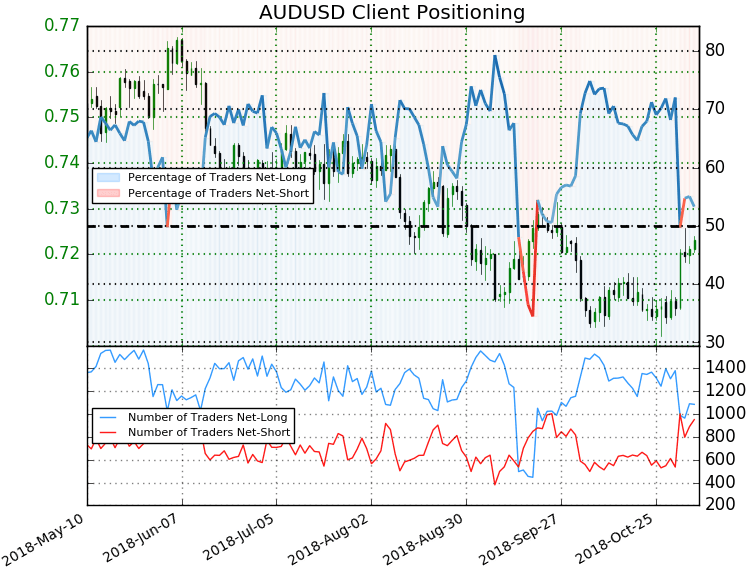
- A summary of IG Client Sentiment shows traders are net-long AUD/USD - the ratio stands at +1.14 (53.3% of traders are long) – weak bearish reading
- Long positions are4.3% higher than yesterday and 18.7% lower from last week
- Short positions are 9.1% higher than yesterday and 66.8% higher from last week
- We typically take a contrarian view to crowd sentiment, and the fact traders are net-long suggests AUD/USD prices may continue to fall. Yet traders are less net-long than yesterday and compared with last week. Recent changes in sentiment warn that the current AUD/USD price trend may soon reverse higher despite the fact traders remain net-long.
See how shifts in AUD/USD retail positioning are impacting trend- Learn more about sentiment!
Relevant AUD/USD Data Releases
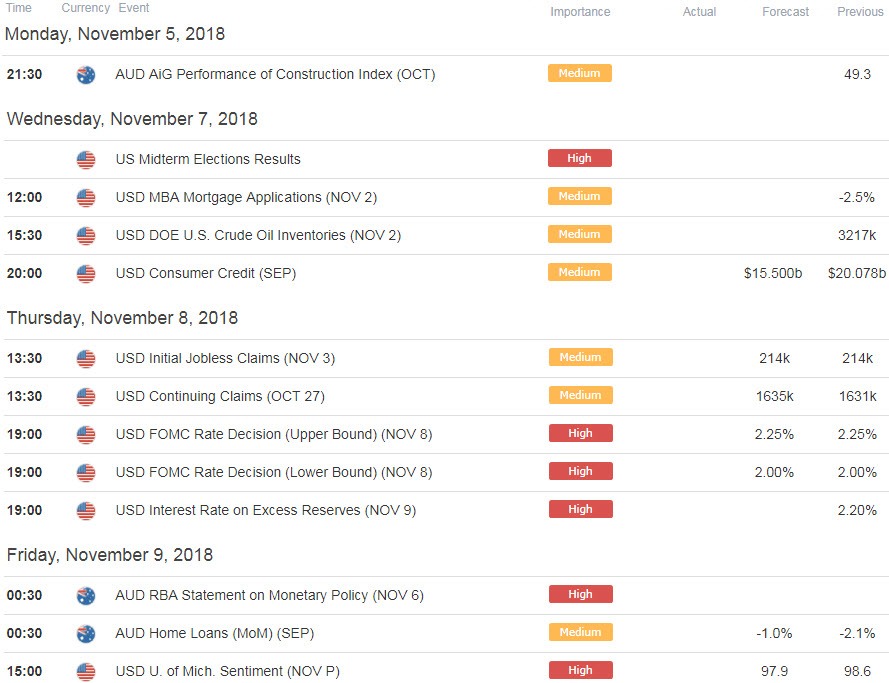
Economic Calendar – for the latest economic developments and upcoming event risk. Learn more about how we Trade the News in our Free Guide!
Previous Weekly Technical Charts
- Gold (XAU/USD)
- Euro (EUR/USD)
- US Dollar Index (DXY)
- Canadian Dollar (USD/CAD)
- Crude Oil (WTI)
- Euro vs Japanese Yen (EUR/JPY)
- New Zealand Dollar (NZD/USD)
Learn how to Trade with Confidence in our Free Trading Guide
--- Written by Michael Boutros, Technical Currency Strategist with DailyFX
Follow Michael on Twitter @MBForex or contact him at mboutros@dailyfx.com


