


- Updated weekly technicals on Crude Oil- price reversal approaching critical support
- Check out our 4Q projections in our Free DailyFX Crude Oil Trading Forecasts
- Join Michael for Live Weekly Strategy Webinars on Mondays at 12:30GMT
In this series we scale-back and take a look at the broader technical picture to gain a bit more perspective on where we are in trend. US Crude Oil prices have fallen more than 10% form the October high with price now approaching critical multi-year slope support. Here are the key targets & invalidation levels that matter on the Crude Oil (WTI) weekly chart. Review this week’s Strategy Webinar for an in-depth breakdown of this setup and more.
New to Trading? Get started with this Free Beginners Guide
Crude Oil Weekly Price Chart (WTI)
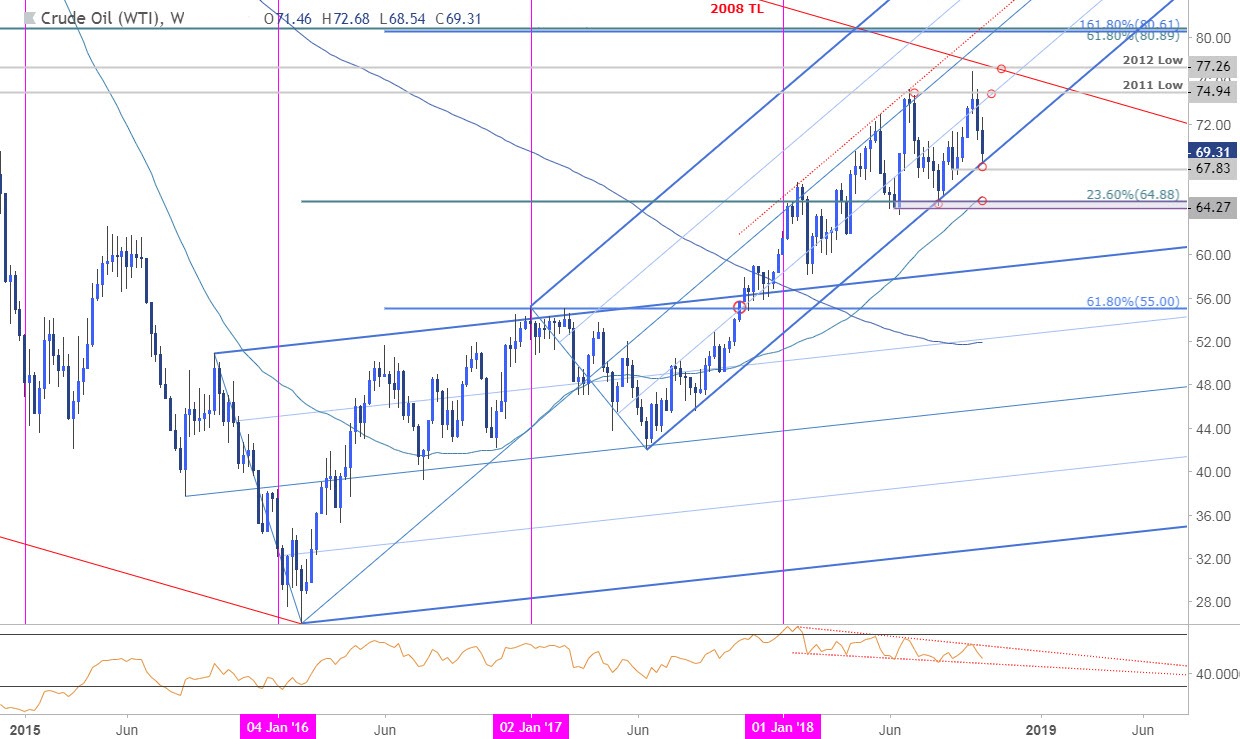
Notes: Earlier this month we highlighted the threat of a reversal in crude as prices approached multi-year highs into the start of Q3. The subsequent pullback now looks to challenge critical support at the lower parallel of the broad ascending pitchfork formation we’ve been tracking off the 2016/2017 lows. It’s make-or-break for the bulls as price tests this multi-year slope support.
A break / weekly close below the September outside weekly-reversal close at 67.83 is needed to validate the break with such a scenario risking a decline towards confluence support at 64.27/65.20 – a region defined by the June close-low, the 23.6% retracement of the 2016 advance and the 52-week moving average. Weekly resistance now back at 74.27/94 (high-week close / 2011 low) with critical resistance steady at the 2008 trendline / 2012 low at 77.26.
For a complete breakdown of Michael’s trading strategy, review his Foundations of Technical Analysis series on Building a Trading Strategy
Bottom line: Crude prices are testing multi-year uptrend support – look for a reaction heading into 67.83 and watch the weekly close. From a trading standpoint, a good spot to reduce short-exposure / lower protective stops. We’ll be on the lookout for possible exhaustion in near-term price action while above this level. Note that weekly RSI has been in a contractionary range since the start of the year with momentum triggers lined up on both sides of the market- the break should offer further guidance / conviction on our medium-term directional bias.
Even the most seasoned traders need a reminder every now and then- Avoid these Mistakes in your trading
Crude Oil Trader Sentiment
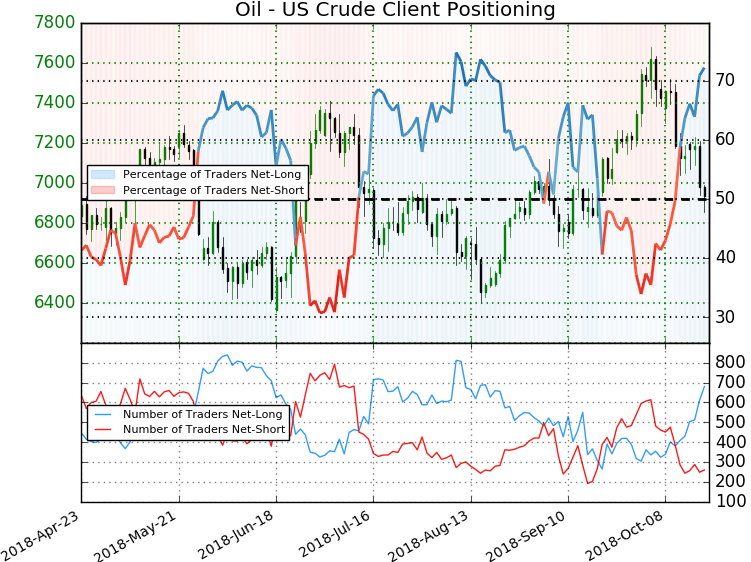
- A summary of IG Client Sentiment shows traders are net-long Crude Oil - the ratio stands at +2.6 (72.2% of traders are long) – bearish reading
- Traders have remained net-long since October 11th; price has moved 2.8% lower since then
- The percentage of traders net-long is now its highest since August 8th
- Long positions are26.6% higher than yesterday and 63.1% higher from last week
- Short positions are 18.1% lower than yesterday and 24.3% lower from last week
- We typically take a contrarian view to crowd sentiment, and the fact traders are net-long suggests Crude Oil prices may continue to fall. Traders are further net-long than yesterday and last week, and the combination of current positioning and recent changes gives us a stronger Crude Oil-bearish contrarian trading bias from a sentiment standpoint.
How to Trade Oil: Crude Oil Trading Strategies & Tips
Previous Weekly Technical Perspectives
- Gold (XAU/USD)
- Euro vs Japanese Yen (EUR/JPY)
- New Zealand Dollar (NZD/USD)
- Australian Dollar (AUD/USD)
- Dollar Index (DXY)
- Euro (EUR/USD)
Learn how to Trade with Confidence in our Free Trading Guide
--- Written by Michael Boutros, Technical Currency Strategist with DailyFX
Follow Michael on Twitter @MBForex or contact him at mboutros@dailyfx.com


