


- A look at the weekly technicals for Crude Oil (USOil)- prices vulnerable sub-75
- Check out our new 3Q Oil price projections in our Free DailyFX Trading Crude Forecasts
- Join Michael for Live Weekly Strategy Webinars on Mondays at 12:30GMT
In this series we scale-back and take a look at the broader technical picture to gain a bit more perspective on where we are in trend. Here are the key targets & invalidation levels that matter on the Crude Oil weekly chart(USOil). Review this week’s Strategy Webinar for an in-depth breakdown of this setup and more.
New to Forex Trading? Get started with this Free Beginners Guide
Crude Oil Weekly Price Chart
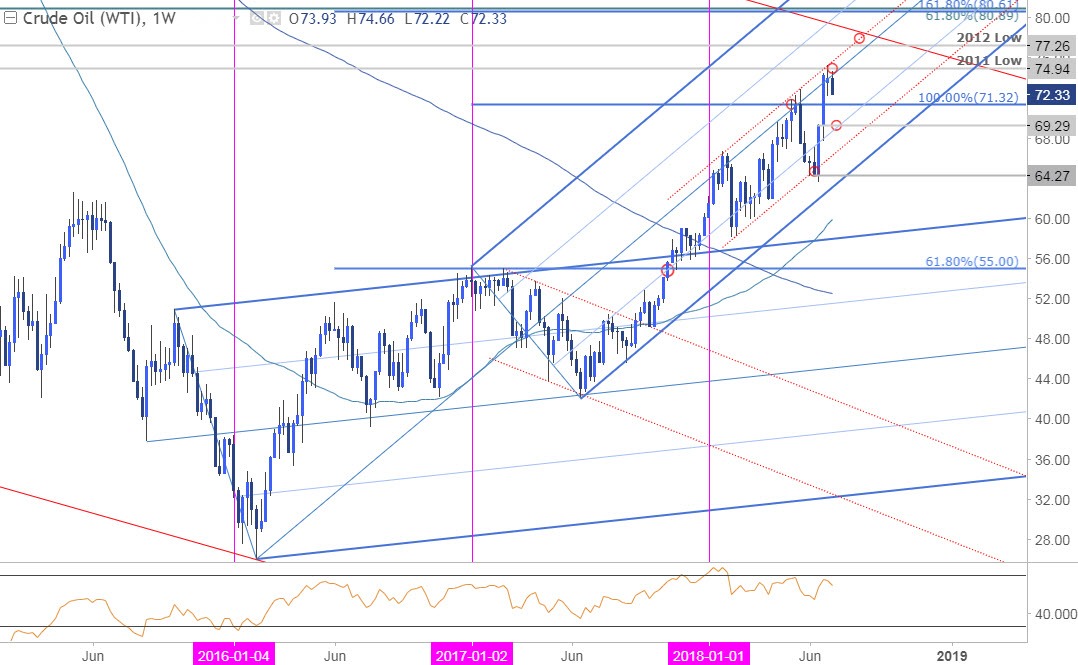
Notes: Crude has been trading within the confines of an ascending pitchfork formation extending off the 2016 low with price turning from confluence resistance last week around the 75-handle. This region is defined by the 2011 swing lows and converges on slope resistance over the next few weeks- note that we’ve also been marking ongoing bearish divergence in the weekly momentum profile.
Interim support targets rests at 71.32 backed by the outside-weekly reversal close at 69.29- a break there would suggest a larger correction is underway targeting the sliding parallel (red) at ~66 and pitchfork support at 64.27- both levels of interest for possible exhaustion / long-entries IF reached. A topside breach invalidates the reversal play with such a scenario eyeing subsequent resistance objectives at the 2012 low at 77.26 backed by the 2008 trendline resistance and a major Fibonacci confluence at 80.61/89.
For a complete breakdown of Michael’s trading strategy, review his Foundations of Technical Analysis series on Building a Trading Strategy
Bottom line: Crude prices are testing up-trend resistance and the immediate threat is lower while below the high-week close at 73.93. From a trading standpoint, I’ll favor fading strength targeting the lower slope lines with the broader outlook still constructive while within this formation.
Even the most seasoned traders need a reminder every now and then- Avoid these Mistakes in your trading
Crude Oil Trader Positioning
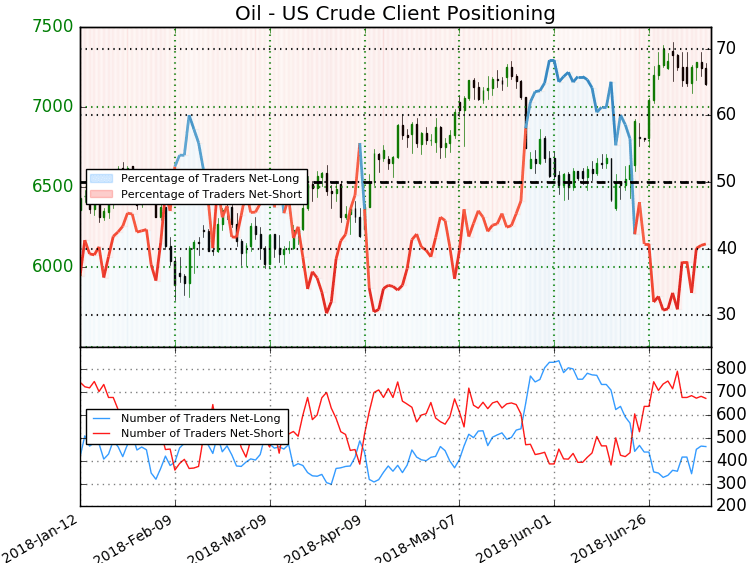
- A summary of IG Client Sentiment shows traders are net-short Crude - the ratio stands at -1.46 (40.7% of traders are long) – weak bullish reading
- Traders have remained net-short since June 22nd; price has moved 9.0% higher since then
- Long positions are 7.4% lower than yesterday and 30.1% higher from last week
- Short positions are2.7% lower than yesterday and 13.6% lower from last week
- We typically take a contrarian view to crowd sentiment, and the fact traders are net-short suggests Oil - US Crude prices may continue to rise. Traders are more net-short than yesterday but less net-short from last week and the combination of current positioning and recent changes gives us a further mixed Oil - US Crude trading bias from a sentiment standpoint.
See how shifts in retail positioning are impacting trend- Learn more about sentiment!
Previous Weekly Technical Perspectives
- Euro (EUR/USD)
- British Pound (GBP/USD)
- Australian Dollar (AUD/USD)
- Canadian Dollar (USD/CAD)
- US Dollar (DXY)
- Japanese Yen (USD/JPY)
--- Written by Michael Boutros, Technical Currency Strategist with DailyFX
Follow Michael on Twitter @MBForex or contact him at mboutros@dailyfx.com


