


- SPX500testing key technical support zones- Prices vulnerable sub-2692
- Check out our 2018projections in our Free DailyFX Trading Forecasts
- Join Michael for Live Weekly Strategy Webinars on Mondays at 12:30GMT
The SPX 500 posted its largest single-day decline since February 2nd with prices now approaching critical structural support which IF broke, could fuel accelerated losses in the index. It’s make-or-break here and the focus is on two nearby support targets to either offer support OR unleash a larger decline in price.
SPX500 Weekly Price Chart
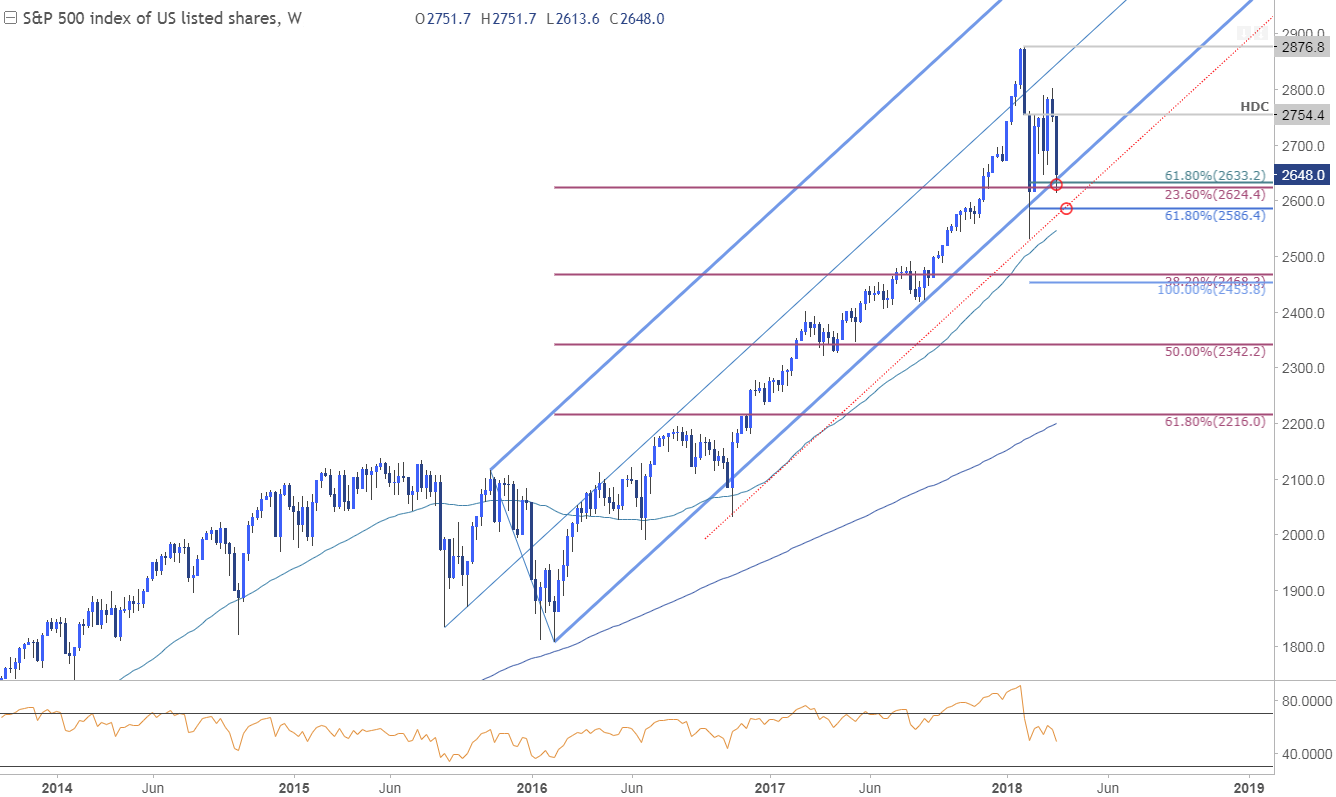
The S&P 500 has been trading within the confines of this broad ascending pitchfork formation extending off the 2015 & 2016 lows. Note that the lower parallel converges on the Fibonacci confluence at 2624/33 this week- watch the close.
SPX500 Daily Price Chart
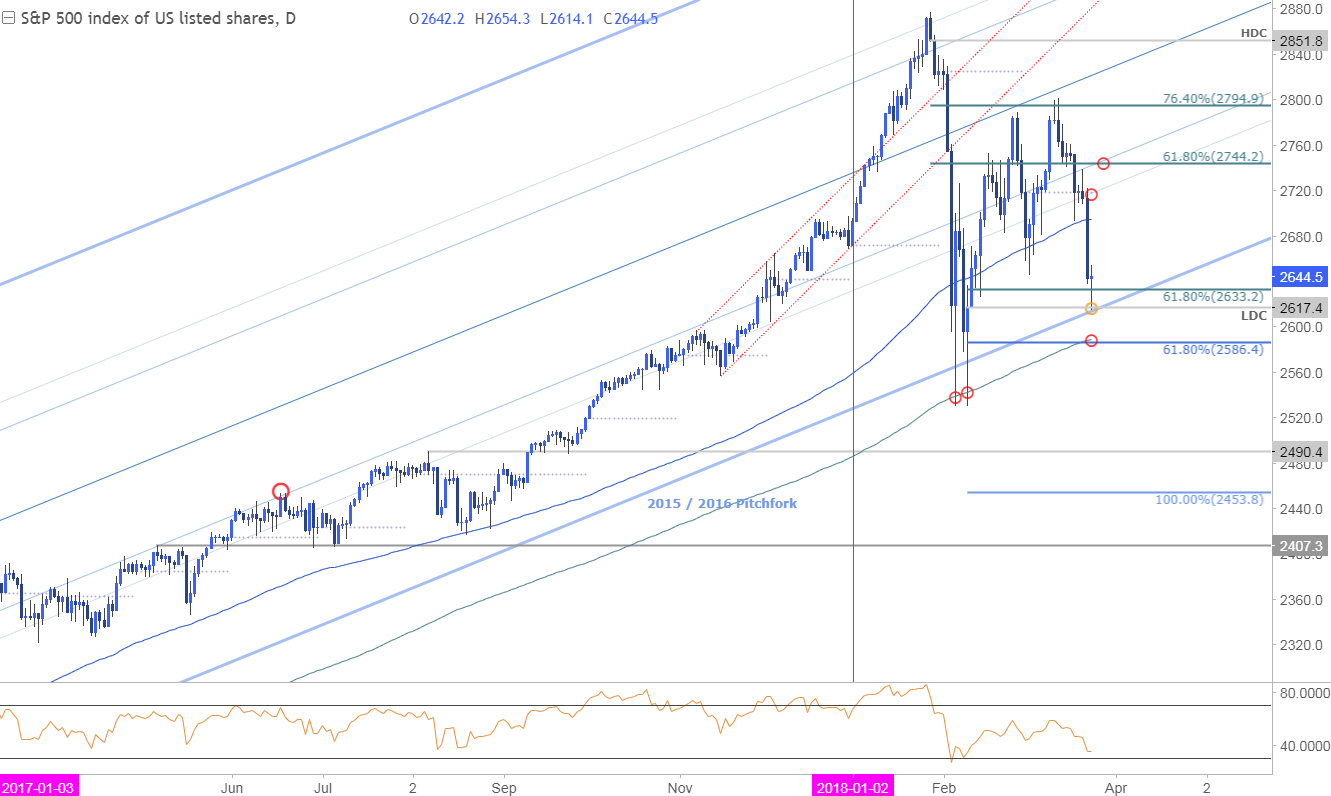
Technical Outlook: A look at daily price action shows the index rebounding today at the 2018 low-day close at 2617. This level is backed closely by the confluence of the 61.8% extension and the 200-day moving average around 2586/90- a break below this threshold could see things get messy in a hurry. Monthly open resistance stands at 2718 with bearish invalidation set to 2744.
Note that the daily momentum profile has exhibited a change in behavior since the start of the year with the pullback from overbought territory in late-January taking RSI sub-30. The subsequent rebound found resistance ahead of 60 and casts a bearish outlook for prices. It’s worth mentioning that we’ve been tracking a price analog from the 1987 crash and if current price patterns hold, suggests a larger decline is underway with a break below this support threshold.
New to Trading? Get started with this Free Beginners Guide
SPX500 240min Price Chart
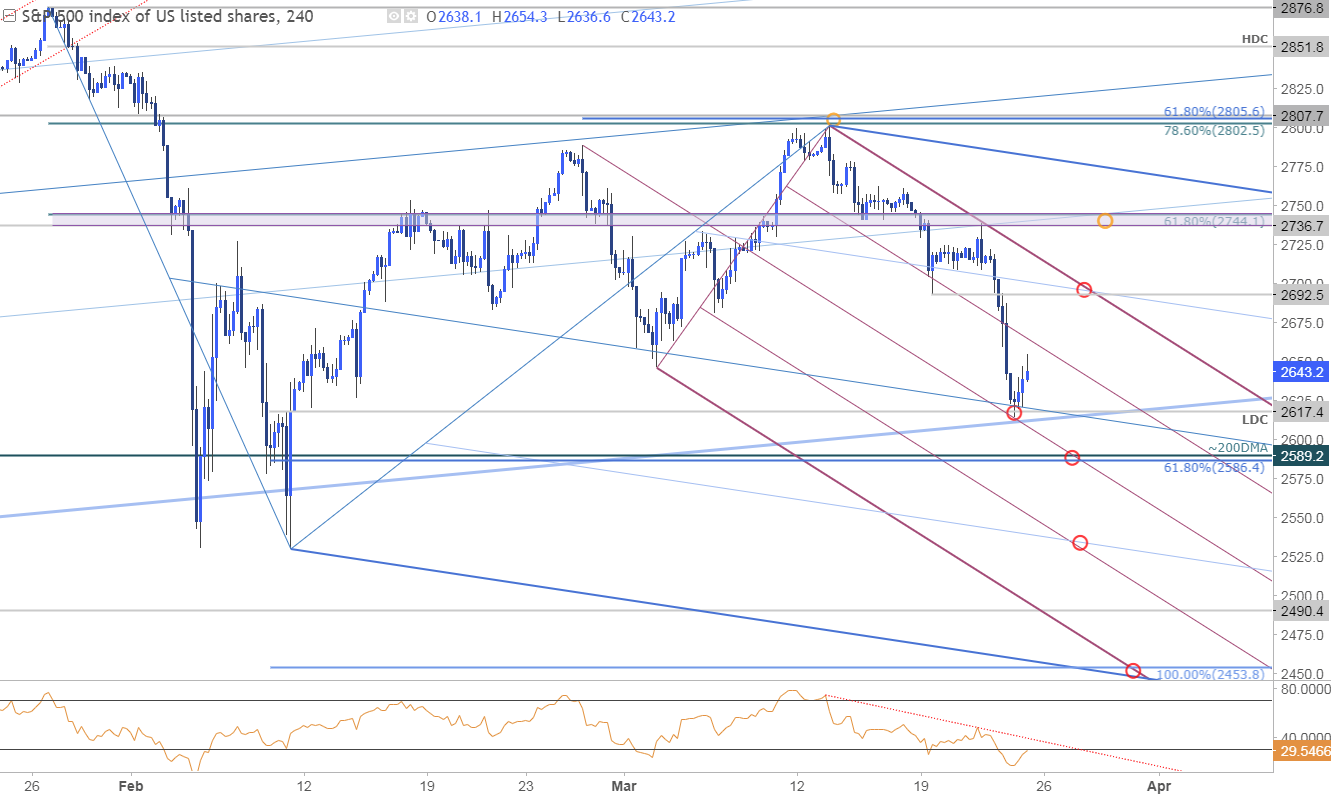
Notes: A closer look at intraday price action highlights numerous slope formations that could be in play here. The focus is on initial resistance at the 50-line of the near-term slope off February / March highs with the risk lower while below confluence resistance at 2692. Ultimately a breach above 2736/44 would be needed to shift the focus back to the long-side.
Why does the average trader lose? Avoid these Mistakes in your trading
A break below the 2617 targets a move on 2586/89 – note that the median-line converges on this slope and further highlights its technical significance. A close below this levels keeps the short-bias in play targeting the slope confluence at around ~2530s backed by key support at 2454.
Bottom line: The SPX500 is approaching critical support zones at 2617 and 2586- If one of these levels doesn’t produce a sizeable recovery, risk markets could be poised for some serious losses.
For a complete breakdown of Michael’s trading strategy, review his Foundations of Technical Analysis series on Building a Trading Strategy
---
Other Setups in Play
- USD/CHF Price Outlook: Risk of Larger Correction If This Level Breaks
- USD/CAD Rally Reverses at Critical Resistance Ahead of Canada CPI
- Weekly Technical Outlook: Dubious Dollar Strength Ahead of FOMC
- EUR/USD Technical Outlook: Price Sell-off to Offer Opportunity
- Written by Michael Boutros, Currency Strategist with DailyFX
To receive Michael’s analysis directly, please sign-upto his email distribution list
Follow Michael on Twitter @MBForex or contact him at mboutros@dailyfx.com


