


Crude Oil, WTI, Technical Analysis - Talking Points:
- Crude oil prices declined amid risk aversion, Biden-Xi Summit
- WTI on course for worst weekly losing streak since March 2020
- Retail upside exposure is rising, offering bearish contrarian view

WTI crude oil prices are on pace for a fourth week of consecutive losses, which would be the worst losing streak since March 2020. That is when futures briefly dipped below $0 during the global coronavirus outbreak. On Wednesday, the commodity closed at its lowest since early October. The energy sector weakened on Wall Street, tracking the decline in WTI.
The growth-sensitive commodity was left vulnerable to deteriorating risk appetite as the Dow Jones, S&P 500 and Nasdaq 100 all closed in the red. This followed softer US housing starts data, which showed homebuilders delaying new projects amid rising material costs and ongoing labor shortages. Traders flocked into Treasuries, pushing up prices as government bond yields fell.
Meanwhile, crude oil prices might have also been impacted by the virtual summit between the United States and China. Presidents Joe Biden and Xi Jinping discussed releasing strategic petroleum reserves amid soaring oil prices. Prospects of higher future supply likely tamed the commodity, and may leave it vulnerable to near-term losses as more information continues to cross the wires.
Check out the DailyFX Economic Calendar for more key events!
Crude Oil Technical Analysis
WTI crude oil could be increasingly vulnerable to a turn lower after prices took out the key 78.24 – 79.15 support zone. This has also confirmed a breakout under the long-term 200-period Simple Moving Average (SMA) on the 4-hour chart below. That has exposed the 38.2% Fibonacci retracement at 76.35 towards the midpoint at 73.55.

WTI 4-Hour Chart
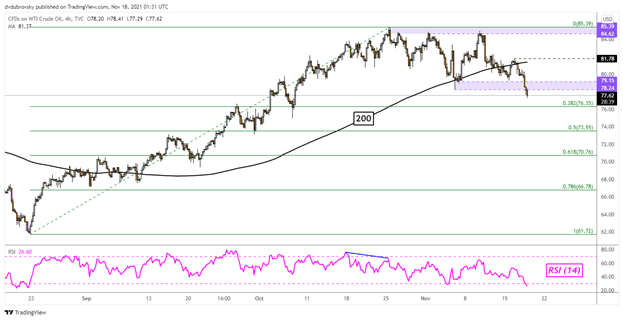
Chart Created Using TradingView
Oil Sentiment Analysis - Bearish
According to IG Client Sentiment (IGCS), retail investors have responded to the decline in crude oil by buying up the commodity. Now, about 58% of them are net-long. Upside exposure increased by 13.45% and 29.37% over a daily and weekly basis respectively. IGCS tends to be a contrarian indicator. The combination of current positioning and recent shifts are offering a bearish-contrarian WTI outlook.
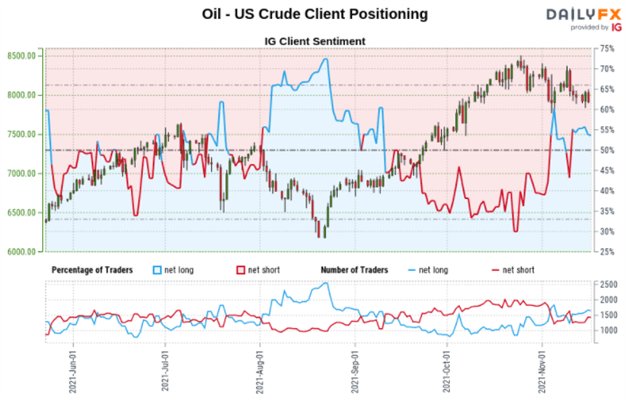
*IGCS chart used from November 18th report
--- Written by Daniel Dubrovsky, Strategist for DailyFX.com
To contact Daniel, use the comments section below or @ddubrovskyFX on Twitter


