


Gold, XAU/USD, 10-Year Treasury Auction, US CPI, Technical Analysis - Talking Points:
- Gold prices weakened despite falling Treasury yields as USD rose
- All eyes are on US CPI data for 1993-high core price growth rate
- XAU/USD at risk to near-term pullback, eyes on key rising support

Anti-fiat gold prices aimed cautiously lower over the past 24 hours despite the 10-year Treasury yield closing at its lowest point in over 3 months. The non-interest-bearing yellow metal can benefit when returns in fixed income assets, particularly US government bonds, deteriorate. Weakness in XAU/USD might have been explained by a rising US Dollar during the Wall Street trading session.
A key driver for Treasuries on Wednesday might have been the outcome of the 10-year Treasury auction. There, the bid/cover ratio – which is a gauge of demand – increased to 2.58 from 2.45 prior. That was the highest in almost one year. Increased demand, and rising bond prices, likely resulted in falling yields. The 10-year rate fell to 1.49% from 1.68% prior. That was the smallest since February.
Another way of looking at this is through the lens of fading inflation expectations. The 5-year breakeven rate, which is a view of anticipated inflation by taking the difference nominal rates and real ones, touched its lowest since early March. Gold is often viewed as an anti-inflationary hedge, so weakening price pressures might explain the yellow metal’s consolidative state since late May.
Over the remaining 24 hours, all eyes are on May’s US CPI report. Core inflation, which strips out volatile items like food and energy prices, is expected to clock in at its highest since early 1993. But, it is unclear to the extent a better-than-anticipated result can materially shift the landscape of Fed tapering expectations given ongoing dovish commentary. That may have to wait until after next week’s interest rate decision.

Gold Technical Analysis
Gold prices may be vulnerable in the near-term from a technical perspective. A bearish ‘Death Cross’ between the 20- and 50-period Simple Moving Averages offers a downside warning. XAU/USD is seemingly being guided lower by a near-term falling trendline from late May. But, rising support from the end of March is maintaining the dominant upside focus. Clearing the latter may open the door to further losses.
XAU/USD 4-Hour Chart
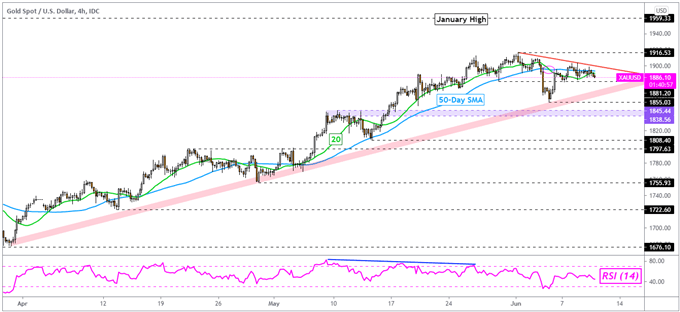
Chart Created Using TradingView
--- Written by Daniel Dubrovsky, Strategist for DailyFX.com
To contact Daniel, use the comments section below or @ddubrovskyFX on Twitter


