


CRUDE OIL & GOLD TALKING POINTS:
- Crude oil prices up on OPEC inventory drain, Nigeria force majeure
- Gold prices in consolidation mode, chart setup hints at bearish bias
- S&P 500 futures signal risk-off tilt into the end of the trading week

Crude oil prices rose yesterday, shrugging off souring risk appetite across broader financial markets that might have been expected to weigh on the cyclically-sensitive commodity. The benchmark WTI contract closed at the highest level in nearly 11 months. Gold prices idled in choppy range confining them all week.
The upswing came as OPEC signaled that its supply-restriction efforts are on track to deplete the world’s brimming inventories. Nigeria was forced to declare force majeure and suspend exports from the country’s leading Forcados terminal amid reports of leaks, which may have helped underpin prices.
Meanwhile, stocks slumped as bond yields rose amid reports that President-elect Biden would propose an expansive fiscal stimulus plan, which he subsequently did. Markets appear worried that the effort might push the Federal Reserve to rein in ultra-loose monetary conditions sooner than previously thought.
Looking ahead, a risk-off tilt seems to be solidifying in the final hours of the trading week. Bellwether S&P 500 futures are pointing convincingly lower and crude oil prices are following suit having seemingly recoupled with overall sentiment trends.
More of the same may be ahead if the downbeat mood is amplified by economic data. US PPI may add to Fed-linked worries if the figures top expectations, echoing the trend in recent price-growth statistics. Meanwhile, the University of Michigan is seen showing that consumer confidence cooled this month.

CRUDE OIL TECHNICAL ANALYSIS
Crude oil prices are testing resistance just below the $54/bbl figure, marked by the 50% Fibonacci expansion. A daily close above that may set the stage for a challenge of the 61.8% level at 55.84. Negative RSI divergence warns of ebbing upside momentum however, hinting at potential topping. A turn back below the 38.2% Fib at 52.15 faces a formidable hurdle in the 49.41-51.03 inflection zone.
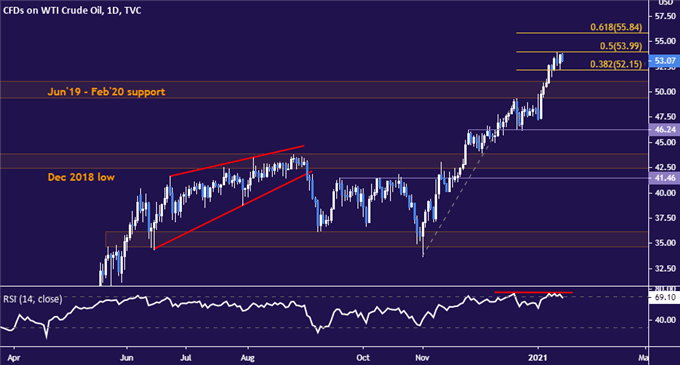
Crude oil price chart created using TradingView
GOLD TECHNICAL ANALYSIS
Gold prices are marking time in a familiar congestion area just above the $1800/oz handle once again. A daily close below support at 1817.13 may set the stage for a retest of former resistance in the 1747.74-65.30 region. Alternatively, a push above the 1860-70 zone might clear the way for another probe above the $1900/oz mark. On balance, the near-term technical bias appears to be bearish.
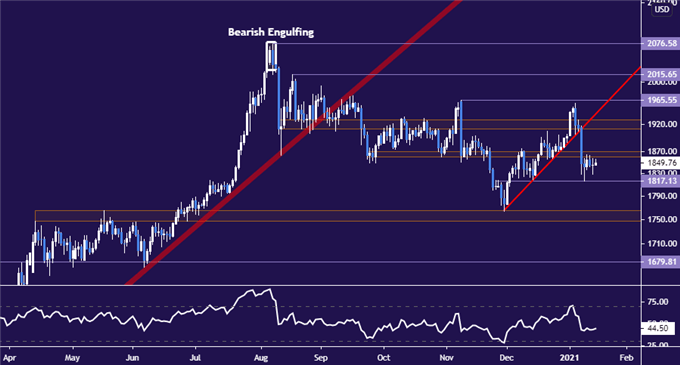
Gold price chart created using TradingView

COMMODITY TRADING RESOURCES
- What is your trading personality? Take our quiz to find out
- See our guide to build confidence in your trading strategy
- Join a free live webinar and have your questions answered
--- Written by Ilya Spivak, Head Strategist, APAC for DailyFX
To contact Ilya, use the comments section below or @IlyaSpivak on Twitter


