


GOLD PRICE OUTLOOK:
- Gold prices traded higher on Tuesday on a weaker US Dollar, improving risk sentiment
- SPDR Gold Trust (GLD) sawcontinuous outflow in recent weeks as gold prices fell
- 85% of retail gold traders (within IG)are net long gold, whereas 15% are net short
Gold prices rebounded from a 5-month low thanks to a softening US Dollar and improved risk sentiment during Asia-Pacific trading. Bullion prices were primarily weighed by a string of positive vaccine news that dented stimulus hopes. As a perceived hedge against fiat money and a store of value, gold prices are particularly sensitive to the US Dollar as well as stimulus prospects. Since Pfizer first announced its vaccine breakthrough on November 9th, gold prices have fallen more than 8%.
The UK was reported to allow hospitals to receive Pfizer’s Covid-19 vaccine soon, and Moderna’s vaccine is seeking the FDA’s approval for emergency use today. Investors have been moving away from gold assets in the past few weeks, reversing a bullish trend seen earlier this year. The overall gold trend appears bearish-biased, although some short-term rebound is still possible.
Seasonally, the year-end appears to be a historically weak time for gold trading. Gold prices registered 10-year average monthly returns of -1.97% and -1.51% in November and December respectively. January and August are among the best-performing months for gold, with 10-year average monthly returns of 2.18% and 3.85% respectively (chart below).
Gold Price 10-Year Average Monthly Performance
| Month | Start | End | Net Change | Percent Change |
|---|---|---|---|---|
| December | 1318.14 | 1293.85 | -24.29 | -1.51 |
| November | 1370.93 | 1346.58 | -24.35 | -1.97 |
| October | 1361.58 | 1370.93 | 9.34 | 0.68 |
| September | 1393.43 | 1361.58 | -31.84 | -2.07 |
| August | 1338.47 | 1393.43 | 54.95 | 3.85 |
| July | 1329.99 | 1338.47 | 8.49 | 0.45 |
| June | 1322.89 | 1329.99 | 7.1 | 0.69 |
| May | 1352.09 | 1322.89 | -29.2 | -1.92 |
| April | 1337.85 | 1352.09 | 14.24 | 1.3 |
| March | 1346.36 | 1337.85 | -8.51 | -0.66 |
| February | 1333.9 | 1346.36 | 12.46 | 1.42 |
| January | 1293.85 | 1333.9 | 40.05 | 3.18 |
Source: Bloomberg, DailyFX

SPDR Gold Trust (GLD) – the world’s largest gold ETF with a market cap of US$ 67.6 billion – saw continuous outflow in recent weeks (chart below) as redemptions outpaced subscriptions. This might have reflected weaker demand for investment gold. The number of GLD shares outstanding has fallen from a recent peak of 437.8 million on September 21st to 409.3 million lately, marking a 10th consecutive weekly decline. Relatively high correlation between gold prices and the number of GLD shares outstanding can be visualized in the chart below.
Gold Prices vs. GLD ETF Shares Outstanding
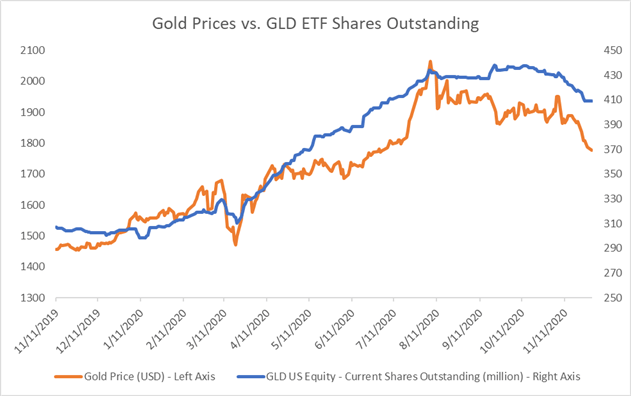
Source: Bloomberg, DailyFX
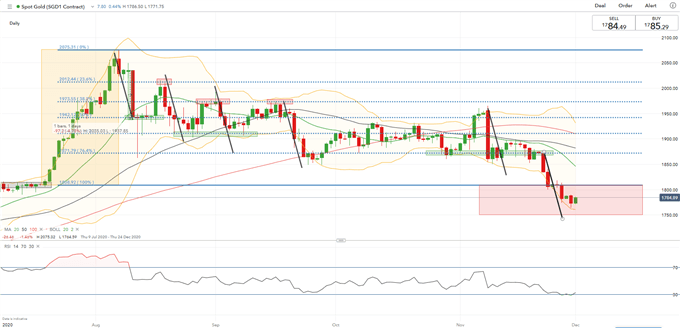
Technically, gold prices broke a key support level of US$ 1,800 last week and thus opened the door for further downside potential with an eye on US$ 1,750 support. The overall trend appears biased toward the downside, as suggested by consecutive lower highs and lower lows. The RSI indicator reached oversold territory, pointing to a potential technical rebound. Prices have also reached the lower Bollinger Band, which is commonly perceived as an immediate support level.
Gold Price – Daily Chart
| Change in | Longs | Shorts | OI |
| Daily | 1% | -3% | -1% |
| Weekly | 2% | -8% | -2% |
IG Client Sentiment indicates that retail gold traders are leaning heavily towards the long side, with 85% of positions net long, while 15% are net short. Traders have increased long (+15%) positions and trimmed short (-5%) bets overnight. Compared to a week ago, traders have added long (+15%) and reduced short (-5%) exposure.

--- Written by Margaret Yang, Strategist for DailyFX.com
To contact Margaret, use the Comments section below or @margaretyjy on Twitter


