


GOLD & CRUDE OIL TALKING POINTS:
- Gold prices pause to digest after biggest one-day drop in over 7 years
- Crude oil prices rise with stocks but remain capped by chart resistance
- Souring risk appetite might apply pressure to commodity prices may
Gold prices managed to find near-term support after Tuesday’s dramatic selloff. That came against the backdrop of improving risk appetite, which weighed on haven demand for the US Dollar and drove it lower. That bolstered the appeal of the yellow metal as an anti-fiat alternative.
Sentiment-geared crude oil prices rose amid the broadly risk-on backdrop. The WTI benchmark tellingly tracked alongside the S&P 500 stock index, a bellwether for the prevailing market mood. EIA data showing US inventories shed a larger-than-expected 4.5 million barrels last week may have helped as well.
Looking ahead, optimism may be fading. Shares fell in Asia-Pacific trade and US stock index futures are trading conspicuously flat, warning that bullish conviction may have faltered. Continued deadlock in US fiscal stimulus negotiations may in part explain investors’ darkening mood.
Gold prices may struggle for direction if this translates into renewed risk-off liquidation. A defensive mood might weigh on yields, bolstering bullion’s appeal store-of-value appeal. It may likewise push the Greenback upward however, producing countervailing downward pressure. Crude oil may fall as stocks retreat.

GOLD TECHNICAL ANALYSIS
Gold prices have paused to consolidate losses having plunged after forming a Bearish Engulfing candlestick pattern, as expected. The drop marked the largest one-day drawdown in over 7 years, so perhaps it is not surprising that a period of digestion has followed.
Tellingly, support-turned-resistance marked by the 38.2%Fibonacci retracementat 1920.71 held up to a retest, with prices failing to close back above the barrier. This may speak to bearish conviction, setting the stage for renewed weakness ahead.
A daily close below the 50% level at 1873.01 looks likely to expose the 1818.14-25.31 zone (July 8 high, 61.8% Fib). Alternatively, reclaiming a foothold above 1920.71 may set the stage for a retest of the 23.6% retracement at 1979.73.
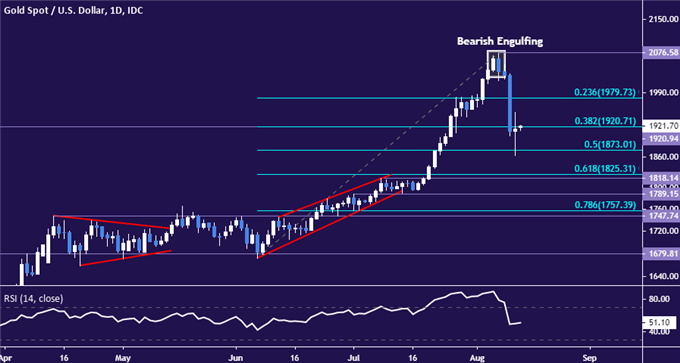
Gold price chart created using TradingView
CRUDE OIL TECHNICAL ANALYSIS
Crude oil prices remain pinned to resistance in the 42.40-43.88 area. A daily close above this barrier looks likely to pave the way for a challenge of the $50/bbl figure. Alternatively, a reversal below initial support at 38.74 might make an opening for a test of the 34.38-78 zone.
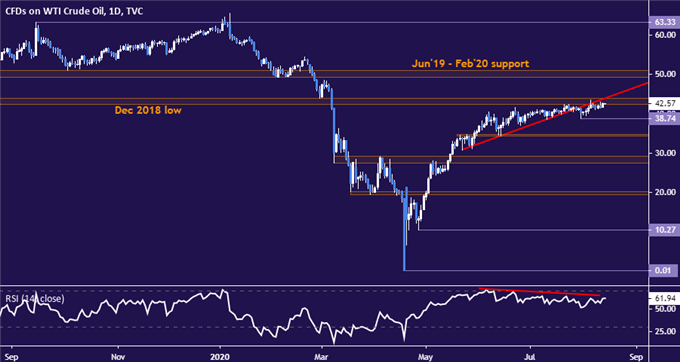
Crude oil price chart created using TradingView

COMMODITY TRADING RESOURCES
- See our free guide on the drivers of crude oil price trends
- What is your trading personality? Take our quiz to find out
- Join a free live webinar and have your questions answered
--- Written by Ilya Spivak, Head APAC Strategist for DailyFX
To contact Ilya, use the comments section below or @IlyaSpivak on Twitter


