


GOLD & CRUDE OIL TALKING POINTS:
- Gold prices drop as upbeat US jobs data shares Fed outlook, inflation bets
- Crude oil prices on the defensive but familiar trading ranges still holding
- US PPI figures, EIA energy outlook and API inventories data now in focus
Gold prices tumbled, with the metal on pace to suffer the largest three-day drawdown since late March. The move seems to come in the wake of Friday’s upbeat US jobs data. Faster-than-expected payrolls and wage growth along with a larger drop in the unemployment rate than markets were projecting has cooled bets on Fed stimulus expansion and trimmed inflation bets, undercutting gold’s store-of-value appeal.
June’s JOLTS job openings data seemed to add fuel to that narrative yesterday. It showed a 5.9 million surge in vacancies, extending for a second month the rebound from April’s Covid-inspired plunge to a six-year low below the 5 million threshold. The figures topped analysts’ projections of a modest pullback to 5.3 million, from the 5.4 million recorded in May.
Crude oil prices are likewise on the defensive as the repricing of US monetary policy expectations to a less-dovish setting tarnishes assets anchored to the global business cycle even as it buoys the US Dollar. The latter move amounts to de-facto selling pressure on the range of assets priced in terms of the go-to reserve currency on global financial markets.
US PPI MAY ADD TO GOLD DROP, CRUDE OIL EYEING EIA OUTLOOK AND API DATA
Looking ahead, the backdrop of shifting Fed policy bets might imbue July’s US PPI report with greater market-moving potential than usual. It is expected to show that the wholesale inflation rate ticked cautiously higher. A print north of baseline forecasts may encourage the current realignment, weighing on gold and crude oil alike while the Greenback continues to reclaim lost ground.
Oil may trade especially heavy if the latest EIA Short-Term Energy Outlook update highlights a likely increase in supply as the OPEC+ output cut scheme is unwound while a deep slump in global economic growth dims demand prospects. API inventory flow figures are also due. They will be weighed against forecasts calling for a 2.8-million-barrel drawdown that traders expect to see in official DOE statistics Wednesday.

GOLD TECHNICAL ANALYSIS
Gold prices turned lower after producing a Bearish Engulfing candlestick pattern, as expected. From here, a daily close below the 23.6% Fibonacci retracement at 1979.73 looks likely to target the 38.2% level at 1920.71 next. Neutralizing selling pressure probably needs a breach and hold above the swing top at 2076.58.
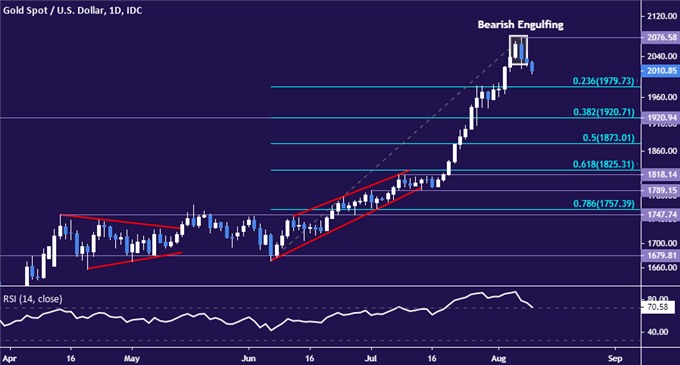
Gold price chart created using TradingView
CRUDE OIL TECHNICAL ANALYSIS
Crude oil prices continue to hug resistance in the 42.40-43.88 area. Establishing a foothold above this barrier looks likely to set the stage for a test of the $50/bbl figure. Alternatively, a turn lower through support at 38.74 may expose the 34.38-78 zone.
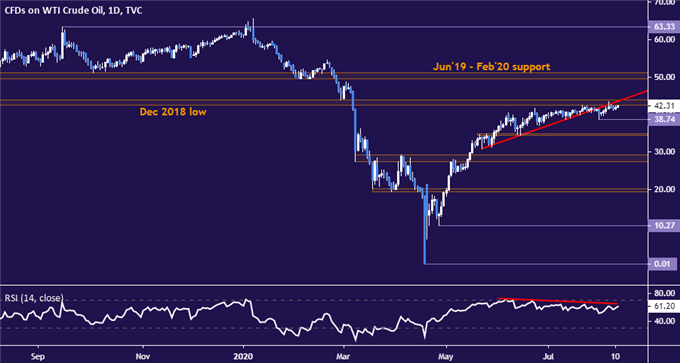
Crude oil price chart created using TradingView

COMMODITY TRADING RESOURCES
- See our free guide on the drivers of crude oil price trends
- What is your trading personality? Take our quiz to find out
- Join a free live webinar and have your questions answered
--- Written by Ilya Spivak, Head APAC Strategist for DailyFX
To contact Ilya, use the comments section below or @IlyaSpivak on Twitter


