


GOLD & CRUDE OIL TALKING POINTS:
- Crude oil may fall if prices make good on double top chart pattern
- Gold prices languishing as US Dollar strength caps scope for gains
- Russell 2000 rebalancing may mean volatility across global markets
Crude oil prices managed to recover a bit of lost ground Thursday as markets digested another round of risk-off liquidation. The lead-in selloff was triggered as easing lockdowns bring on a spike in Covid-19 cases, particularly in the US. Gold prices languished as the haven US Dollar held onto gains scored in risk-off trade, capping the appeal of anti-fiat alternatives.
Looking ahead, May’s US personal income and spending data headlines the calendar. A rebound in outlays after April’s double-digit drop is expected to be counterbalanced by the largest monthly earnings drop on record. The Fed’s favored PCE inflation gauge may show that core price growth slowed to 0.9 percent on year. That now seems hardly as influential on Fed policy, and thereby markets, as it has been in the past.
The rebalancing of the Russell 2000 stock index may drive volatility however. The companies making up the small-cap benchmark are relatively more vulnerable to the coronavirus-induced slump than their behemoth counterparts in the Dow or the S&P 500, so a large reallocation whose effects ripple out across global financial markets seems entirely possible.

CRUDE OIL TECHNICAL ANALYSIS
Crude oil prices continue to hint at double top potential as negative RSI divergence speaks to ebbing upside momentum below resistance in the 42.40-43.88 area. Bearish reversal confirmation probably calls for a daily close below support at 34.78. The 27.40-29.11 inflection zone follow thereafter. Alternatively, a push above resistance likely targets $50/bbl next.
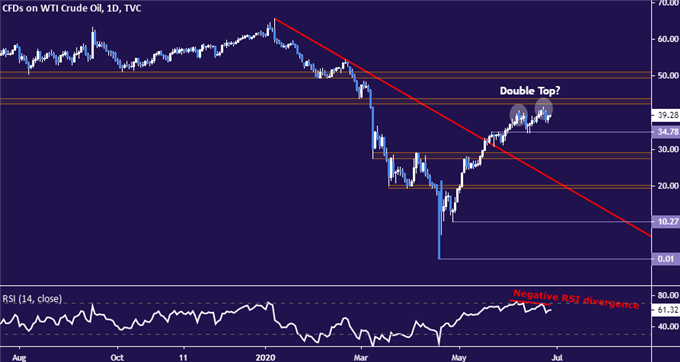
Crude oil price chart created using TradingView
GOLD TECHNICAL ANALYSIS
Gold prices are digesting losses having slid after the formation of a Bearish Engulfing candlestick pattern. Minor support is at 1759.29, but the true test of sellers’ mettle probably sits in the 1744.58-45.59 area. A daily close below that would double as a breach of trend line support from early June.The range top at 1729.86 follows, now recast as support.Alternatively, reclaiming a hold above 1765.30 eyes 1779.38 next.
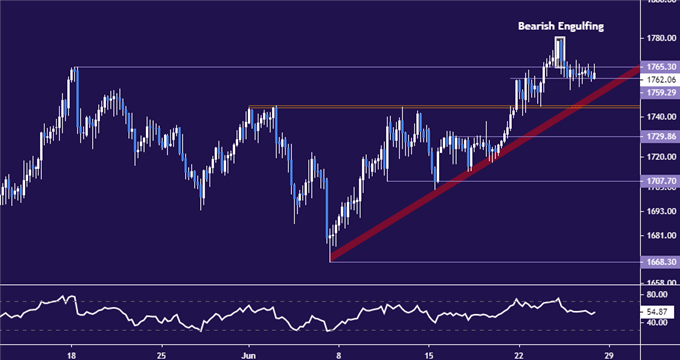
Gold price chart created using TradingView

COMMODITY TRADING RESOURCES
- See our free guide on the drivers of crude oil price trends
- What is your trading personality? Take our quiz to find out
- Join a free live webinar and have your questions answered
--- Written by Ilya Spivak, Head APAC Strategist for DailyFX
To contact Ilya, use the comments section below or @IlyaSpivak on Twitter


