


CRUDE OIL & GOLD TALKING POINTS:
- Crude oil prices offer tame response to OPEC+ output cut extension
- Gold prices pressuring support after upbeat US employment figures
- World Bank economic outlook update, ECB’s Lagarde now in focus
Crude oil prices rose alongside stocks while gold prices plunged as US employment data topped analysts’ forecasts (as expected). The economy added 2.5 million jobs in May, smashing estimates calling for an 8 million drawdown. The unemployment rate fell to 13.3 percent, marking a stark contrast with baseline projections calling for a rise to 19.8 percent.
An OPEC+ agreement to extend the coordinated output cut scheme helped the WTI benchmark gap higher at the weekly trading open but lasting momentum has not materialized, at least so far. Furthermore, bellwether S&P 500 stock index futures are trading flat even as Asia-Pacific bourses play catch-up to Friday’s buoyant Wall Street showing, hinting that risk-on capital flows may be struggling for follow-through.
Looking ahead, the World Bank is due to issue its semi-annual economic outlook update while ECB President Christine Lagarde is due to speak at the European Parliament. Downbeat headlines are likely to emerge from both. World Bank President David Malpass has previously envisioned a “deep global recession”. Ms Lagarde has been similarly gloomy, though seeing a recovery beginning in the third quarter.

CRUDE OIL TECHNICAL ANALYSIS
Crude oil prices continue to inch toward resistance in the 42.40-43.88 area. A daily close above this barrier probably opens the door for a test at the underside of former range support near the $50/bbl figure. Alternatively, a turn back below 34.78 seems to target the 27.40-29.11 inflection zone next.
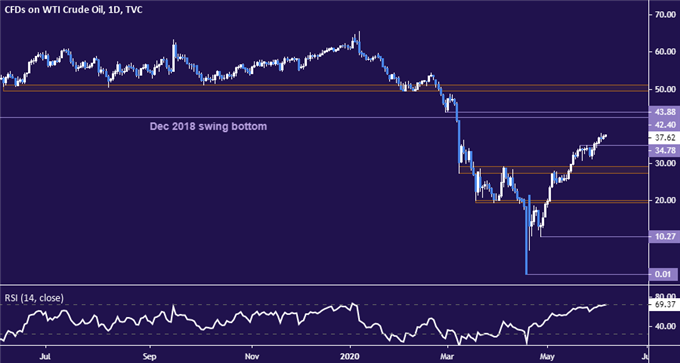
Crude oil price chart created using TradingView
GOLD TECHNICAL ANALYSIS
Gold prices continue to pressure support in the 1679.81-93.92 area, with a beak downward secured on a daily closing basis seeming to initially expose the 38.2% Fibonacci retracement at 1645.40 thereafter. Near-term resistance continues to be marked by the May 18 highat 1765.30.
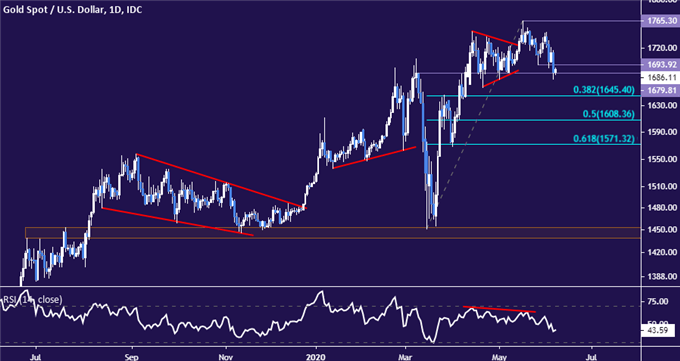
Gold price chart created using TradingView

COMMODITY TRADING RESOURCES
- See our free guide on the drivers of crude oil price trends
- What is your trading personality? Take our quiz to find out
- Join a free live webinar and have your questions answered
--- Written by Ilya Spivak, Head APAC Strategist for DailyFX
To contact Ilya, use the comments section below or @IlyaSpivak on Twitter


