


Gold and Crude Oil Talking Points:
- Gold prices edged down again as markets looked to Wednesday’s trade deal signing
- There may be some scope for disappointment, but markets are hopeful that more progress will be made
- Crude oil was steady, with the market eyeing the possibility of increased demand
Gold prices continued to slip on Tuesday with overall global risk appetite still on the up as the markets eye an interim trade deal between China and the United States due to be signed in Washington on Wednesday.
The US has also dropped its designation of China as currency manipulator, which has lightened the mood still further, with markets sensing that there’s some chance of broadly improved relations between the world’s two largest economies.
A senior US Chamber of Commerce official tempered expectations somewhat when he was reported by CNBC as saying on Monday that the deal will ‘stop the bleeding’ but won’t provide an end to trade war as significant challenges remain.
Chinese trade data for December came in extremely strongly, with the country’s customs department saying that imports from the US had improved markedly- even before the deal is signed. Gold prices slipped a little after the data although, paradoxically, so did Chinese stocks. In a world worried about Chinese debt levels, strong numbers can be seen as ‘bad news’ to the extent that they might stay Beijing’s stimulus and make it harder for borrowers to roll their commitments over.
| Change in | Longs | Shorts | OI |
| Daily | 1% | -3% | -1% |
| Weekly | 2% | -8% | -2% |
Gold Technical Analysis
Gold prices have clearly also shed their Iran-related gains, but they remain comparatively elevated, a fact perhaps at odds with the risk appetite evident elsewhere.

Falls have so far been arrested close to the top of an admittedly broad trading range which, with small exceptions, has bounded activity since August 2019. Still, prices remain close to levels not previously seen since 2013, and support from last September in the $1522 area will likely hold the bears should prices break back into their former range.
Crude Oil Prices Still Surprisingly Weak on Daily Charts
Crude oil prices were steady meanwhile, with that trade deal very much the market focus. China and the US remain after all by far the world’s biggest two national energy consumers so the prospect of increased demand from both is a powerful prop, especially as traditional producers have cut supply.
US inventory data this week are expected to show further drawdowns too, according to an influential survey from Reuters and this expectation may also be supporting prices.
Crude Oil Technical Analysis
US crude oil prices have fallen sharply since markets began to judge that there was little chance of escalating military conflict between the US and Iran.
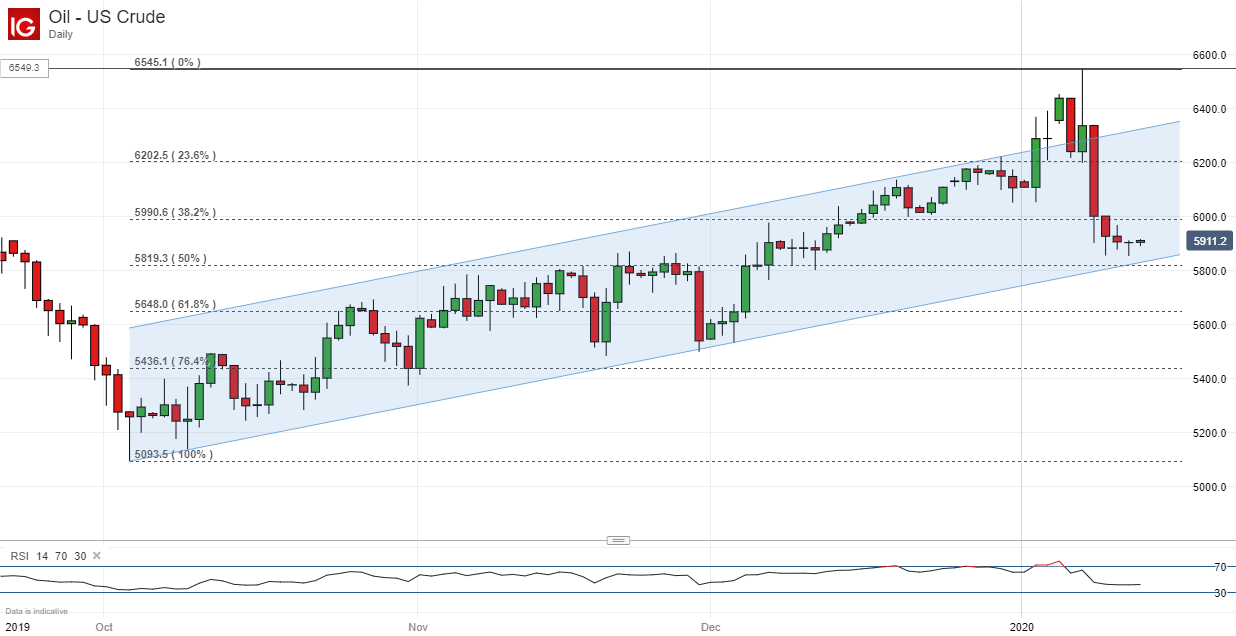
Given the rather broader market optimism seen elsewhere it is perhaps a little surprising that prices should now be flirting with the bottom of their uptrend channel and its is plausible to suggest that the removal of Iran-related risk premiums has perhaps gone a little far, given the market’s obvious vigor before the Iran story broke at all.
Still for now prices are flirting with 50% Fibonacci retracement of the rise from October’s low’s to this month’s peaks. That comes in at $58.19/barrel and a break below this on a daily or weekly closing basis would probably see that uptrend channel broken too. Still, the market looks a little oversold right now and, given that increased risk appetite elsewhere, a bounce back well into the channel may be seen assuming Wednesday’s trade deal doesn’t disappoint.
| Change in | Longs | Shorts | OI |
| Daily | 3% | -7% | 1% |
| Weekly | 31% | -38% | 7% |
Commodity Trading Resources
- See our guide to learn about the long-term forces driving crude oil prices
- Having trouble with your strategy? Here’s the #1 mistake that traders make
- Join a free webinar and have your commodity market questions answered
--- Written by David Cottle, DailyFX Research
Follow David on Twitter @DavidCottleFX or use the Comments section below to get in touch!


