


Gold and Crude Oil Talking Points:
- Crude oil prices inched up as US-China trade hopes returned to the fore
- Investors seem more sanguine that war between Iran and the US is not coming
- Still, gold prices retain significant underlying strength
| Change in | Longs | Shorts | OI |
| Daily | 1% | -3% | -1% |
| Weekly | 2% | -8% | -2% |
Crude oil prices edged very slightly higher in Asia on Monday as investors looked forward to the planned signing of an initial US-China trade deal which remains slated for Wednesday.
They surged early last week after the killing of a key Iranian commander, in Baghdad, by a US drone strike only for that obvious risk premium to be scaled back as Washington and Iran backed away from full-scale military conflict. The situation remains tense and fluid, however. Four Iraqi soldiers were wounded in an attack on an airbase Sunday, while the US has refused demands to withdraw its own troops from Iraq.
Still, US-China trade and the looming corporate earnings season are keeping the energy bid in place. While there’s plenty of likely market interest in the coming week’s scheduled events, Monday doesn’t offer any likely market movers. Investors will have to wait for trade deal details on Wednesday and, probably, the release of official Chinese growth numbers on Friday.
Gold Pressured as Risk Appetite Favors Bolder Choices
Gold prices took a modest hit through the session. Trade hopes contrived once again to support risk appetite and weigh on counter-cyclical ‘haven’ assets such as the yellow metal and the Japanese Yen. A broadly stronger US Dollar may have also detracted from gold’s charms.
The trade deal itself may well disappoint markets, with the real meat of a substantial trade accord left to the second phase agreement which at this point has no time frame. A Wall Street Journal report on Saturday said that the two sides have consented to semi-annual talks to push reform and resolve any disputes. The markets seem to have taken this as a positive step forward, but all the same gold remains very close to last year’s highs on its daily charts, with very little obvious profit-taking impetus kicking in.
Crude Oil Technical Analysis
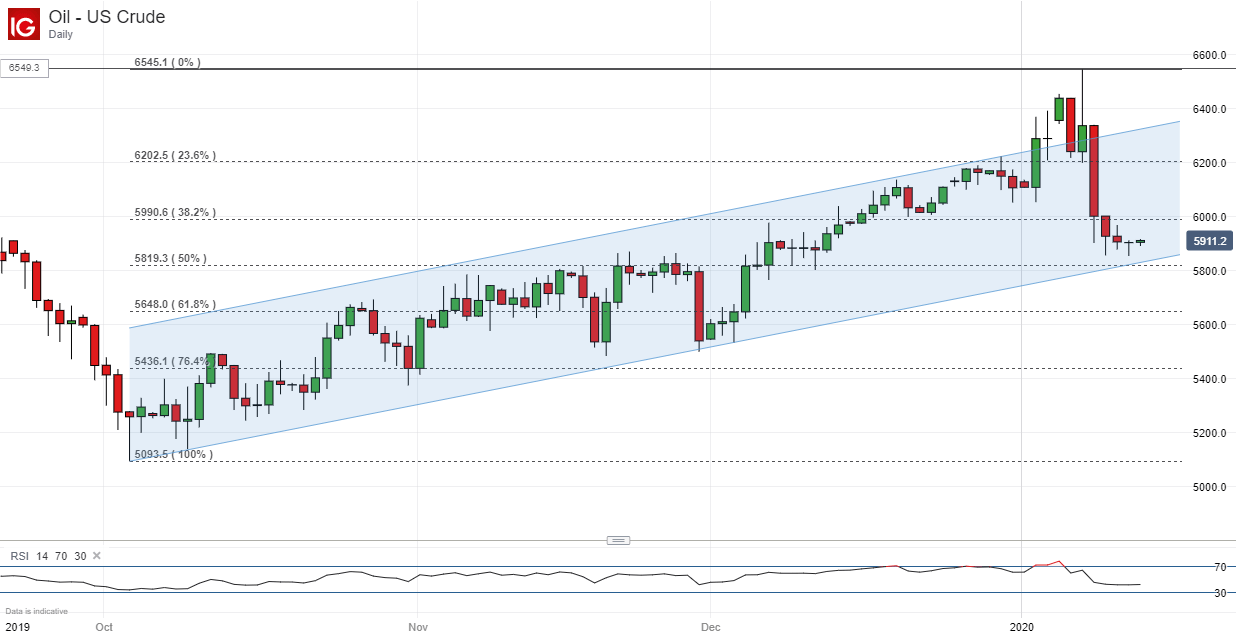
US crude oil prices’ recent falls seem a little overdone in the context of the strong bid which preceded last week’s Iraq-induced swoon. They seem to be bottoming out above the key 50% Fibonacci retracement level of their strong rise between October 2019 and this month.
However, there seems little appetite to push back to the top of the uptrend channel which bulls dominated for much of December. This suggests that there could be more doubt about the forthcoming trade agreement than might be though from a look at global equity.
The big near-term question will be whether the market can build a durable base around current levels or whether the uptrend channel must face a test. The market now looks quite neutral in terms of momentum so the week’s daily chart action could be instructive.
Gold Technical Analysis
The monthly chart shows the resilience of gold’s underlying haven bid even as markets move to price in a little more world-trade optimism.
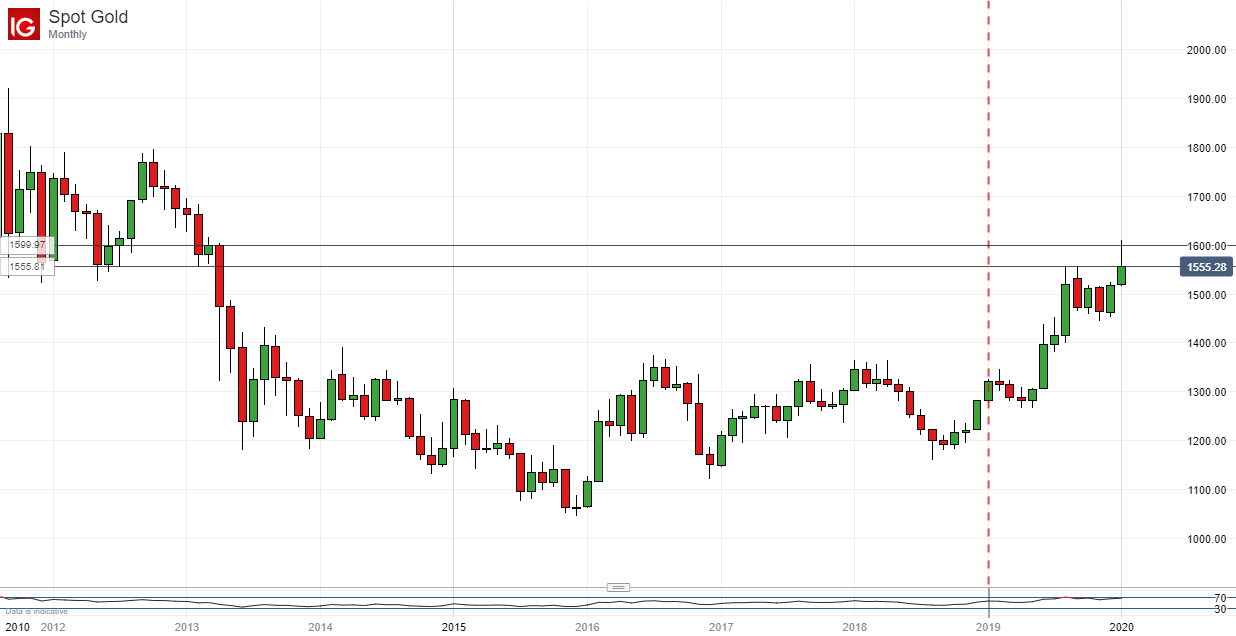
Prices remain very close to their 2019 peaks and at highs not previously seen for more than five years. It’s worth pointing out thought hat January’s performance has been flattered by increased demand stemming from worries that military confrontation between Iran and the US would escalate.
Had that not been so January’s candlestick would probably look a lot more like the four which preceded it, and the impression that gold prices might be topping out around current levels would be stronger than it now looks.
Where the metal closes out this month promises to be fascinating. The bulls have clearly had a good year, but they still have a lot of work to do if they’re to claw back all the steep fall seen between October 2012 and June 2013. 2019’s rise did about half the job, and the rest looks like a big ask if risk appetite holds up.
| Change in | Longs | Shorts | OI |
| Daily | 3% | -7% | 1% |
| Weekly | 31% | -38% | 7% |
Commodity Trading Resources
- See our guide to learn about the long-term forces driving crude oil prices
- Having trouble with your strategy? Here’s the #1 mistake that traders make
- Join a free webinar and have your commodity market questions answered
--- Written by David Cottle, DailyFX Research
Follow David on Twitter @DavidCottleFX or use the Comments section below to get in touch!


