


Gold and Crude Oil Talking Points:
- Gold continued lower as overall risk appetite held up
- Trade is back to the fore as Iran slips from the spotlight
- Crude oil prices lost a bit more of their risk premium
| Change in | Longs | Shorts | OI |
| Daily | 1% | -3% | -1% |
| Weekly | 2% | -8% | -2% |
Gold prices continued to retreat in Friday’s Asia-Pacific session as market focused moved from Iran to trade prospects, and from caution to optimism.
It became clear on Thursday that the US Administration’s response to Iranian attacks on bases in Iraq would be predominantly non-military and focused on sanctions. This calmed initial worries that Washington and Tehran were on a path to war, but clearly the situation remains fluid.
However, Wall Street managed new records, and investors are looking forward to the signing of a phase-one trade deal between China and the US on January 15. Gold prices may not slide very far on this prospect, however, with the more substantive phase two deal possibly on ice until after the US Presidential election in November and maybe far beyond that.
Still there has been an undeniable revival in risk appetite and, as usual , that makes the going tougher for haven assets like gold.
Gold Technical Analysis
Gold prices have slipped back below their 2019, a level they punched strongly above this week as Iran-related worries dominated global markets.
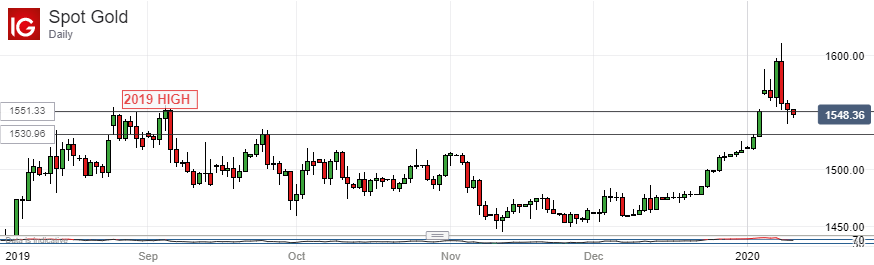
They have abandoned those levels up near $1,600/ounce, leaving the notable high of September 24 at $1,530.96 as near-term support. That level had marked the market’s highest point until as recently as January 2, and acted as something of a cap before finally being breached.
Gold had retained a substantial bid even before the US airstrike on Iranian General Quassim Soleimani and its overall uptrend would not appear to be threatened. However the market remains quite close to overbought territory and further modest falls and consolidation looks likely if risk appetite holds up.
Crude oil prices continued to fall, responding perhaps a little unusually to much the same impetus as that which dragged on gold. However, whereas gold has slipped as haven assets find themselves out of favor, oil is merely shedding the risk premium which was piled onto prices in response to Iran-related worries. Prices have lost about 4% in the past couple of days, but, again, it’s important to remember that oil was pretty well bid even without the Iran story, and that markets are looking hopefully towards increased demand in 2020.
Commodity markets will now look like all others towards official US labor data, due for release later Friday. Only 166,000 new nonfarm jobs are expected for December but the overall jobless rate is predicted to remain steady at a relatively comforting 3.5%.
Crude Oil Technical Analysis
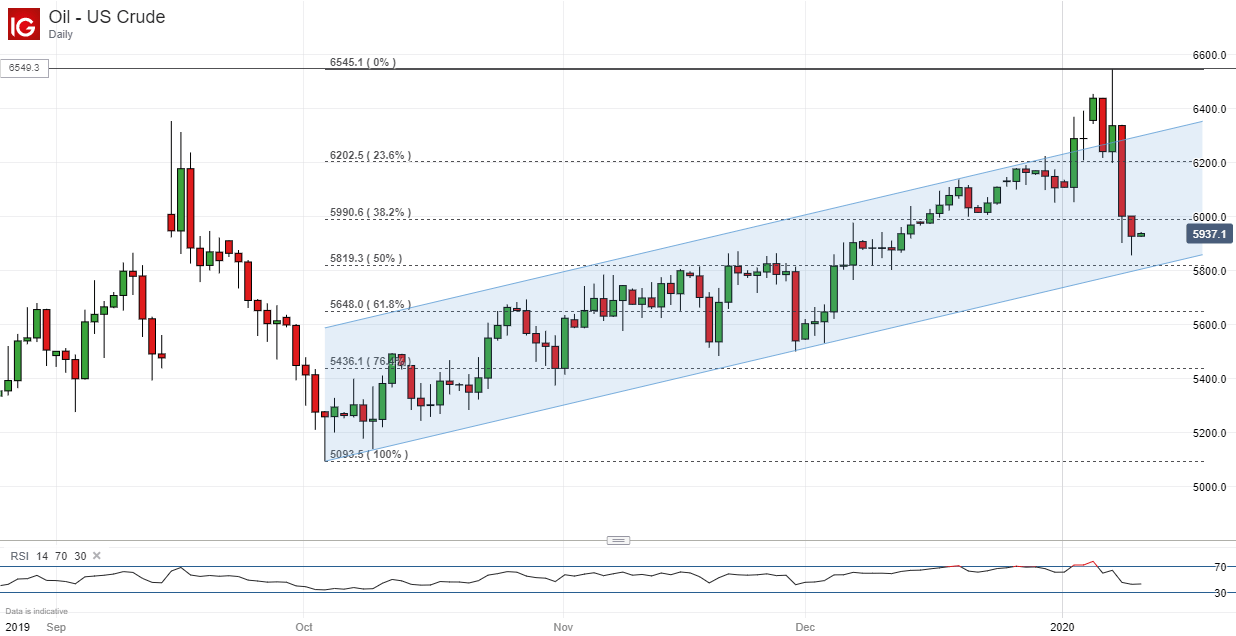
Prices remain caught between the first and second Fibonacci retracement levels of their rise from the lows of October to January’s peaks. It’s notable on the daily chart that they’re also getting closer to the lower boundary of their dominant uptrend channel than they’ve been at any point since early December, when the channel held. Momentum indicators suggest that prices are edging toward oversold territory after the strong falls of this week, and they may soon edge back up toward the upper boundary of the channel where they were so at home in the runup to this week’s Iran-related gains.
| Change in | Longs | Shorts | OI |
| Daily | 3% | -7% | 1% |
| Weekly | 31% | -38% | 7% |
Commodity Trading Resources
- See our guide to learn about the long-term forces driving crude oil prices
- Having trouble with your strategy? Here’s the #1 mistake that traders make
- Join a free webinar and have your commodity market questions answered
--- Written by David Cottle, DailyFX Research
Follow David on Twitter @DavidCottleFX or use the Comments section below to get in touch!


