


Crude Oil and Gold Talking Points:
- Crude oil prices rose sharply but slipped back as Asian trade wound down
- Gold prices followed a similar pattern but held more of their gains
- The next US move against Iran will probably decide direction
| Change in | Longs | Shorts | OI |
| Daily | 3% | -7% | 1% |
| Weekly | 31% | -38% | 7% |
Crude oil prices spiked sharply higher on Wednesday in the Asia Pacific region as Iran launched a series of ballistic missile attacks aimed at US and coalition bases in Iraq, in retaliation for last week’s US airstrike which killed top Iranian General Qasem Suleimani in Baghdad.
Heightened military tensions in the world’s chief oil producing region is of course always likely to send oil prices soaring and, with Iran having said that targets in both Israel and the United Arab Emirates could be hit if the US retaliates, it’s hardly surprising that risk appetite should have been smashed.
However, the US response has so far been perhaps less bellicose than some in the market had clearly feared and oil prices retraced most of their gains as the session went on. President Donald Trump Tweeted that he would make a statement to the US people ‘in the morning’ after consultation with his security advisors. He also Tweeted somewhat enigmatically that ‘all is well.’
That statement is very likely to grab most of the markets’ attention, but US crude oil stockpile numbers will probably play a role if the Iran story lets them. The market has been surprised by the scale of drawdowns for the last three weeks and is now on watch for another.
Crude Oil Technical Analysis
US crude oil prices remain extremely well supported by events in Iran, but have retreated back towards the top of their previously dominant uptrend.
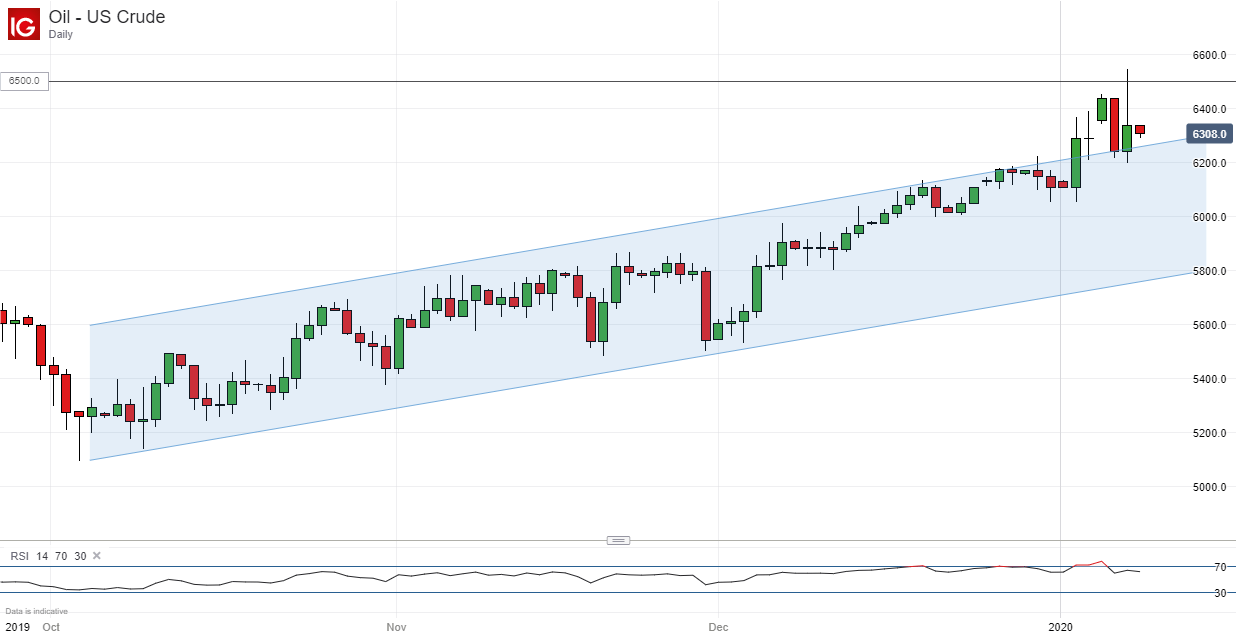
Given the confluence of higher expected demand, should US-China trade relations improve, and weaker supply thanks to cuts from traditional exporters, it is hard to see a meaningful pullback even if there the Middle East de-escalation many third countries call for. Still, that upper-channel boundary is probably acting as near-term support, with further near-term props likely around December 22’s low of $60.06/barrel.
The bulls’ most pressing upside target remains the psychological $65 level which guards the way back to April’s highs. Of course, further military action on the part of either Tehran or Washington could see this level topped in short order.
Gold prices topped the $1600/oz mark for the first time since March, 2013 on Wednesday as investors piled into counter-cyclical haven assets with risk appetite fading. However, they quickly retreated back under that point and have shed about five dollar since, with the market apparently uncertain that the US will hit back militarily in the near-term.
Gold Technical Analysis
Like the oil market, gold looks a little overextended now, not that that is likely to matter much as the haven bid seems likely to endure. It was pretty strong even before the US strikes on Baghdad last week.
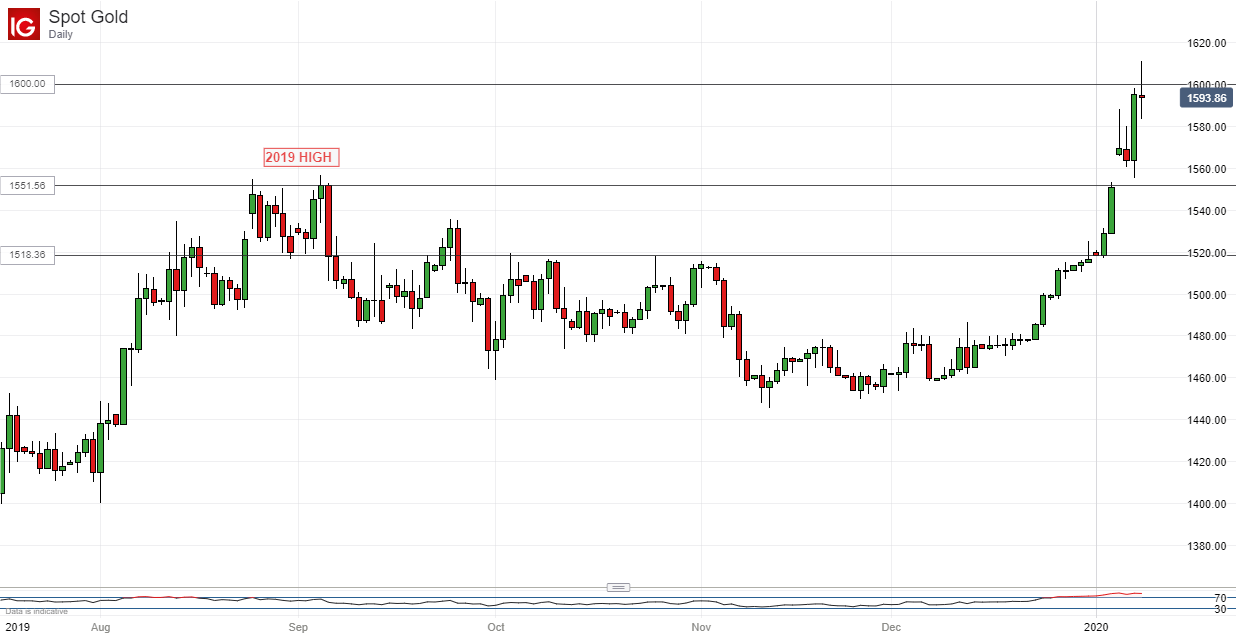
Assuming that the $1600 handle is not durably topped, retracement will probably be limited to a broad band between 2019’s September high of $1551.56 and the low which marked the end of that period of strength, September 5’s close of $1518.36.
| Change in | Longs | Shorts | OI |
| Daily | 1% | -3% | -1% |
| Weekly | 2% | -8% | -2% |
Commodity Trading Resources
- See our guide to learn about the long-term forces driving crude oil prices
- Having trouble with your strategy? Here’s the #1 mistake that traders make
- Join a free webinar and have your commodity market questions answered
--- Written by David Cottle, DailyFX Research
Follow David on Twitter @DavidCottleFX or use the Comments section below to get in touch!


