Gold and Crude Oil Talking Points:
- Gold prices got some support from a weaker US Dollar
- The market remains driven by US-China trade hopes, but gold has survived a risk appetite surge
- Crude oil fundamentals look quite strong, but prices are still capped by December’s highs
| Change in | Longs | Shorts | OI |
| Daily | 1% | -3% | -1% |
| Weekly | 2% | -8% | -2% |
Gold prices edged up on Thursday, albeit in markets clearly still thinned by the holiday calendar, as a bit of Dollar weakness supported the oldest haven asset of all.
The greenback in turn slid as 2019 bowed out, with some investors clearly prepared to bet that the old year’s theme of US economic outperformance won’t be as pronounced in 2020, especially if trade tensions between Washington and Beijing ebb. While an interim phase one trade deal is set to be signed on January 15, a more substantive agreement remains very much in the balance but, for now, markets seem prepared to give trade negotiators the benefit of any doubt.
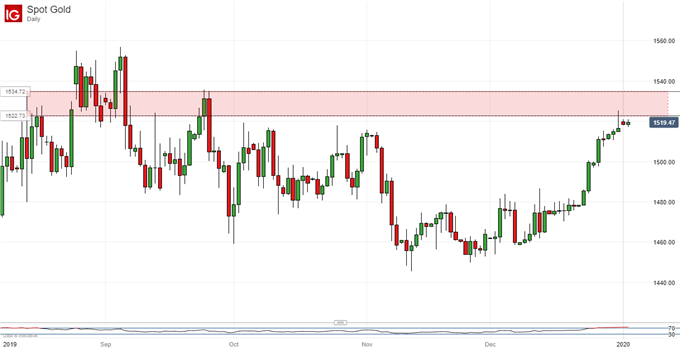
Still, for all the notable risk appetite revival evident in markets from equity to commodity currencies, gold prices remain around four-month highs after soaring through December. This suggests perhaps a little more uncertainty than beacons such as record Wall Street highs might suggest. Worries persist about underlying Chinese growth, the health of the Eurozone and the possibility of revived military tensions in the Middle East as the US and Iranian backed militia square off in Syria and Iraq. Chinese handling of pro-democracy protests in Hong Kong also looms over the market.
It will therefore be fascinating to see how much gold retrace its gains once details of the first trade deal are known.
For now, spot prices remain apparently capped by a band of resistance derived from the highs of late September.

That said December 31’s daily candle looks as though it might be what’s known as a shooting star. This type of daily formation can be indicative of a price top and so bears close watching. However, the market looks unsurprisingly overbought in any event after such sharp gains and a period of consolidation may be due in any case, whether or not that flags up any deeper falls.
The remainder of Thursday’s session will offer Purchasing Managers Index data from Europe North America. These are usually closely watched and market moving but may be less so now, both thanks to the holidays and because focus is so fixed on trade. News that China’s private manufacturing sector continued its modest expansion into December largely passed Asia Pacific markets by on Thursday, although January’s edition may well draw a crowd as missed expectations last month raise the prospect that the series’ rum of gains may be ending.
Crude Slips a Little, Market Fundamentals Look Highly Supportive
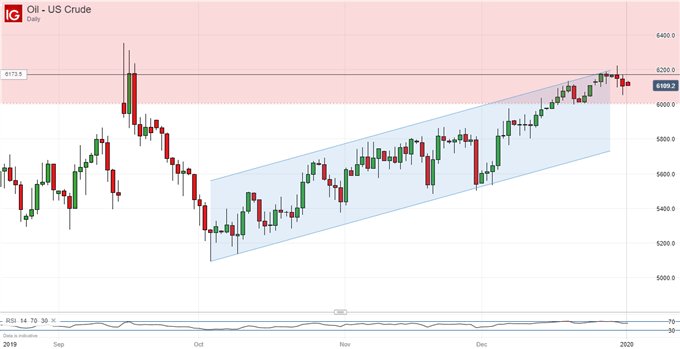
Crude oil prices have plenty of underlying support, both from those increased geopolitical tensions and for hopes that a trade revival will boost demand, at a time when traditional producers have cut supply. The US has seen surprising inventory drawdowns in the past month and January will mark the start of reductions agreed by the Organization of Petroleum Exporting Countries and Russia in December.
However, the price of a barrel continued to inch back on Thursday, as it has done since hitting three-month highs on December 30. The impetus to take profit is not strong, however, even after a run of solid gains since October, and the longer- term uptrend looks utterly unthreatened.

| Change in | Longs | Shorts | OI |
| Daily | 3% | -7% | 1% |
| Weekly | 31% | -38% | 7% |
Commodity Trading Resources
- See our guide to learn about the long-term forces driving crude oil prices
- Having trouble with your strategy? Here’s the #1 mistake that traders make
- Join a free webinar and have your commodity market questions answered
--- Written by David Cottle, DailyFX Research
Follow David on Twitter @DavidCottleFX or use the Comments section below to get in touch!


