


CRUDE OIL & GOLD TALKING POINTS:
- Crude oil prices edge up on US-China trade deal, UK election
- Gold prices fall as bond yields rise amid swelling risk appetite
- Details of formal Washington, Beijing agreement now in focus

Crude oil prices rose alongside stocks amid a broad-based swell in risk appetite amid signs that a phase-one US-China trade deal has been agreed, at least “in principle”. The chipper mood was reinforced as early polling data following the UK general election showed the Conservatives on track to in a commanding majority. That was taken to mean that the incumbent administration’s Brexit deal will be ratified, reducing uncertainty.
Investors’ upbeat mood translated into higher bond yields as capital poured out of anti-risk government bonds. That understandably undermined the appeal of non-interest-bearing assets, punishing gold prices. The metal flirted with the upside earlier in the day – touching a five-week high – but the late-day surge in confidence saw those gains erased and a downside close recorded.
CRUDE OIL, GOLD PRICES EYE FORMAL US-CHINA TRADE DEAL NEWS
Looking ahead, buoyant S&P 500 stock index futures suggest the risk-on mood may carry into the week-end. Follow-through will probably hinge on a formal announcement of the US-China trade deal or at least firm confirmation that a tariff hike previously planned for December 15 has been shelved. November’s US retail sales report headlines the data docket. The largest rise in 3 months is expected, at 0.5 percent.
GOLD TECHNICAL ANALYSIS
Gold prices continue to mark time within a narrow range carved out since mid-November, but broader positioning reveals the outlines of a bullish Falling Wedge pattern. Confirming the setup on a daily close above 1484.63 would suggest the end of a corrective pullback has set the stage for longer-term uptrend resumption. The next layer of resistance is in the 1516.05-23.05 area. Support extends down from 1453 to the Wedge floor, now at 1427.51.
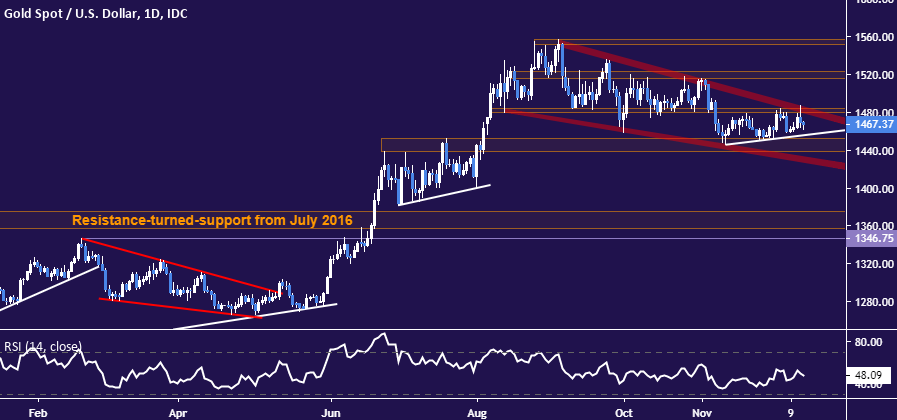
Gold price chart created using TradingView
CRUDE OIL TECHNICAL ANALYSIS
Crude oil prices continue to idle below resistance in the 60.04-84 area. Negative RSI divergence is a nod to ebbing upside momentum, hinting that a downswing may be ahead. Breaking below rising channel support (now at 56.07) exposes the 50.52-51.00 range floor. Alternatively, a push above resistance sees the next upside hurdle at 63.38, marked by September’s high.

Crude oil price chart created using TradingView
COMMODITY TRADING RESOURCES
- See our guide to learn about the long-term forces driving crude oil prices
- Having trouble with your strategy? Here’s the #1 mistake that traders make
- Join a free webinar and have your commodity market questions answered
--- Written by Ilya Spivak, Currency Strategist for DailyFX.com
To contact Ilya, use the comments section below or @IlyaSpivak on Twitter


