


CRUDE OIL & GOLD TALKING POINTS:
- Crude oil prices seesaw on US GDP revision, echoing stocks
- Gold prices idle, chart setup warns that a top is taking shape
- US PCE figures might cool Fed rate cut bets, sour sentiment
Commodity prices struggled for directional conviction Thursday. Crude oil prices fell alongside stocks and benchmark Treasury bond yields amid a bout of risk aversion in early Wall Street trade, but the move fizzled and retraced by day’s end, leaving the WTI contract nearly flat. Gold prices idled.
Revisions within updated second-quarter US GDP data appeared to spook markets initially. While the headline annualized growth rate was confirmed at 2 percent, the pace of private consumption growth was downgraded while the core PCE gauge printed at a higher-than-expected 1.9 percent on-year.
Taken together, this warns the pillar of US economic resilience – the consumer – may be on shakier ground than markets appreciate, even as the Fed is led away from further rate cuts by nearly on-target price growth. Nevertheless, traders were unwilling to commit with gusto to a risk-off push.
CRUDE OIL PRICES MAY FALL AS FIRM PCE DATA TRIMS FED RATE CUT BETS
From here, a timelier version of the Fed’s favored PCE inflation measure covering August is in focus. It is expected at 1.8 percent on-year, marking the third consecutive month of gains. If it tops forecasts like the quarterly reading published yesterday, investors’ mood might sour as rate cut hopes dwindle.
Crude oil prices seem likely to face selling pressure alongside other cycle-sensitive assets in this scenario. Gold might have been expected to capitalize on de-risking but scope for that seems limited when worries about higher-than-desired interest rates are the inspiration for divestment.
Get our free guide to help build confidence in your gold and crude oil trading strategy !
GOLD TECHNICAL ANALYSIS
Gold prices continue to work towards completing a Head and Shoulders (H&S) topping pattern. A daily close below 1480 would confirm the setup, implying a measured move down through support in the 1437.70-52.95 area and toward the $1400/oz figure. A daily close above 1535.03 aims for 1563.00 next.
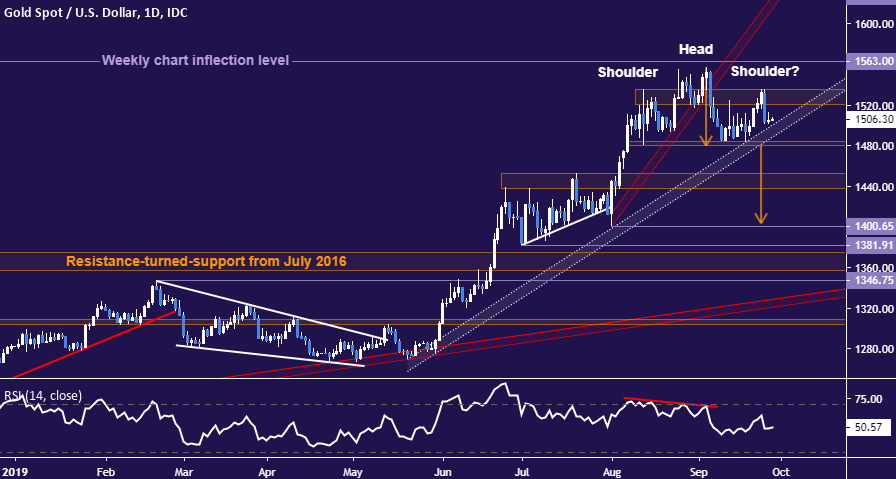
Gold price chart created using TradingView
CRUDE OIL TECHNICAL ANALYSIS
Crude oil prices are marking time atop support defining the rise since early August. A daily close below this barrier opens the door for a test of support clustered around the $50/bbl figure. Alternatively, a rebound above resistance levels at 58.76 and 60.84 exposes September’s swing high at 63.38.
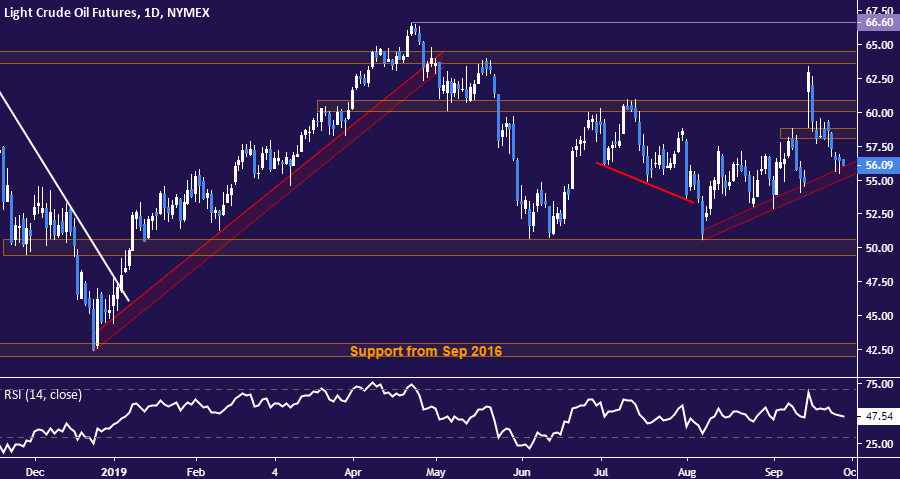
Crude oil price chart created using TradingView
COMMODITY TRADING RESOURCES
- See our guide to learn about the long-term forces driving crude oil prices
- Having trouble with your strategy? Here’s the #1 mistake that traders make
- Join a free webinar and have your commodity market questions answered
--- Written by Ilya Spivak, Currency Strategist for DailyFX.com
To contact Ilya, use the comments section below or @IlyaSpivak on Twitter


