


GOLD & CRUDE OIL TALKING POINTS:
- Crude oil prices spike sharply higher as Houthis strike Saudi Arabia
- Gold prices up amid risk aversion but chart setup warns of topping
- FOMC policy announcement may be quick to recapture the spotlight
Gold prices rose as markets quaked after Yemen’s Houthi rebels struck energy infrastructure in Saudi Arabia, producing a wild jump in crude oil prices. Yields fell as capital scrambled for the safety of government bonds, boosting the relative appeal of the non-interest-bearing yellow metal. Bellwether S&P 500 futures duly tracked lower also, warning that more of the same might be in the cards.
Still, the case for immediate follow-through seems somewhat shaky. While the hit to supply capacity is very real indeed, ample reserves and abundant capacity of US shale might mean that the markets’ initial shock at the weekend’s news flow could subside as gold traders refocus their attention on a more pressing matter: the FOMC monetary policy announcement.
Get our free guide to help build confidence in your gold and crude oil trading strategy !
GOLD TECHNICAL ANALYSIS
Gold prices may be carving out a bearish Head and Shoulders (H&S) chart pattern below resistance at 1563.00, a weekly chart inflection level. Confirmation of the setup on a daily close below support at 1480.00 would imply a measured downside target within a hair of the $1400/oz figure. Negative RSI divergence seems to bolster the case for a downside scenario.

Gold price chart created using TradingView
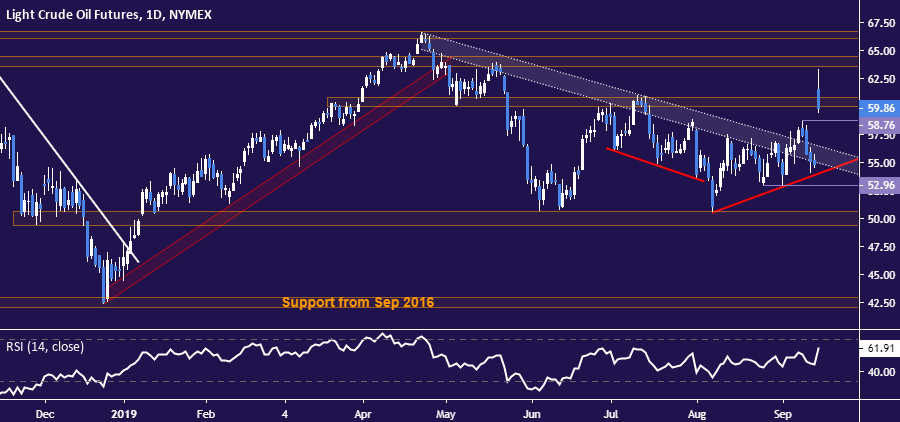
CRUDE OIL TECHNICAL ANALYSIS
Crude oil prices are settling downward after a dramatic upward gap at the start of the trading week. A daily close back below the $60/bbl figure initially sets the stage for a retest of the September 10 high at 58.76. Immediate resistance is in the 63.59-64.43 zone, with a push above that exposing April’s swing top.
Crude oil price chart created using TradingView
COMMODITY TRADING RESOURCES
- See our guide to learn about the long-term forces driving crude oil prices
- Having trouble with your strategy? Here’s the #1 mistake that traders make
- Join a free webinar and have your commodity market questions answered
--- Written by Ilya Spivak, Currency Strategist for DailyFX.com
To contact Ilya, use the comments section below or @IlyaSpivak on Twitter


